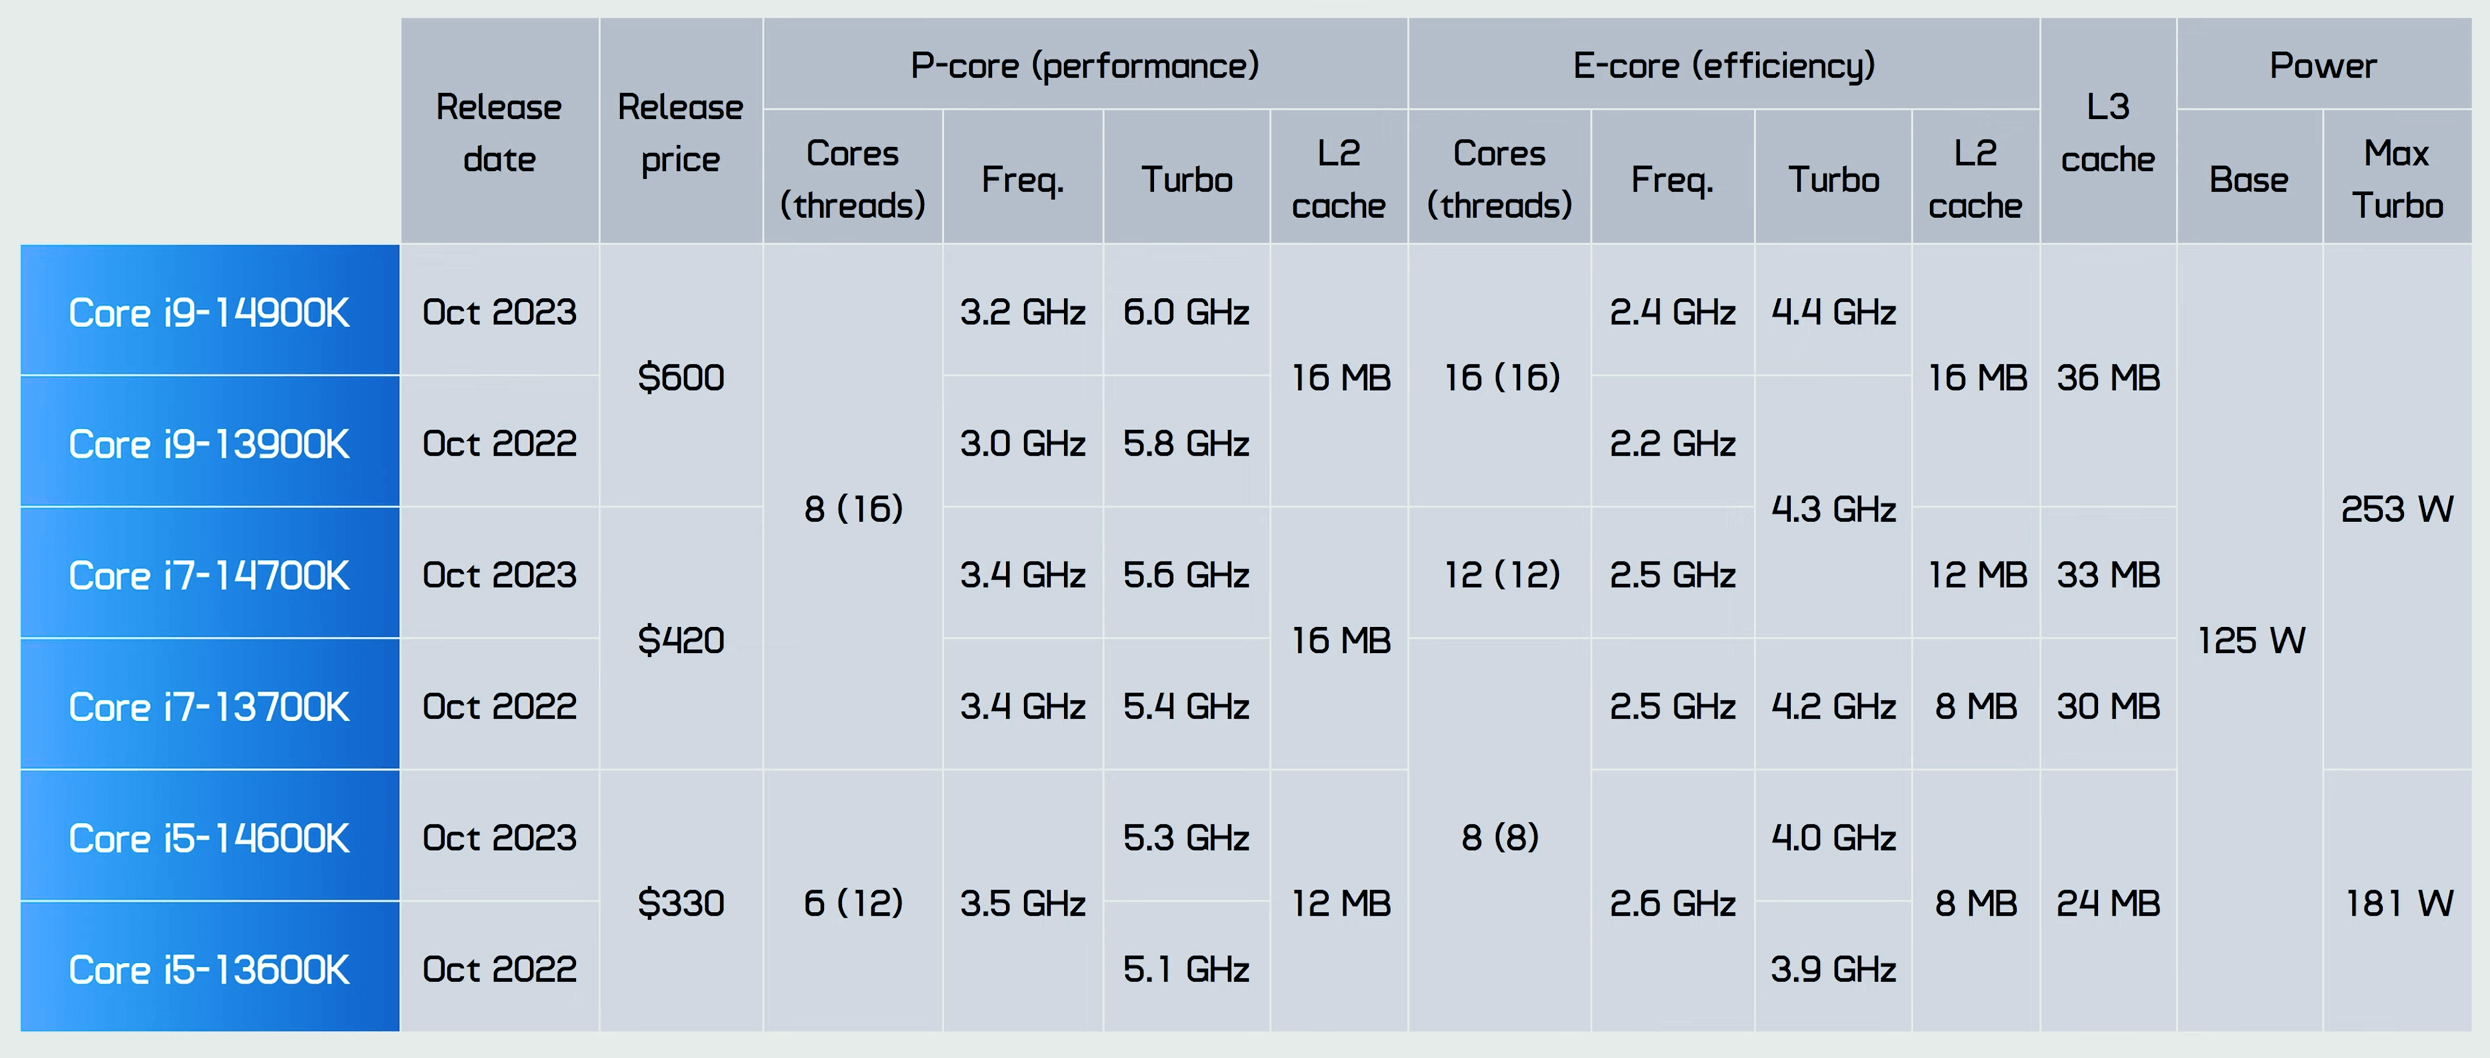
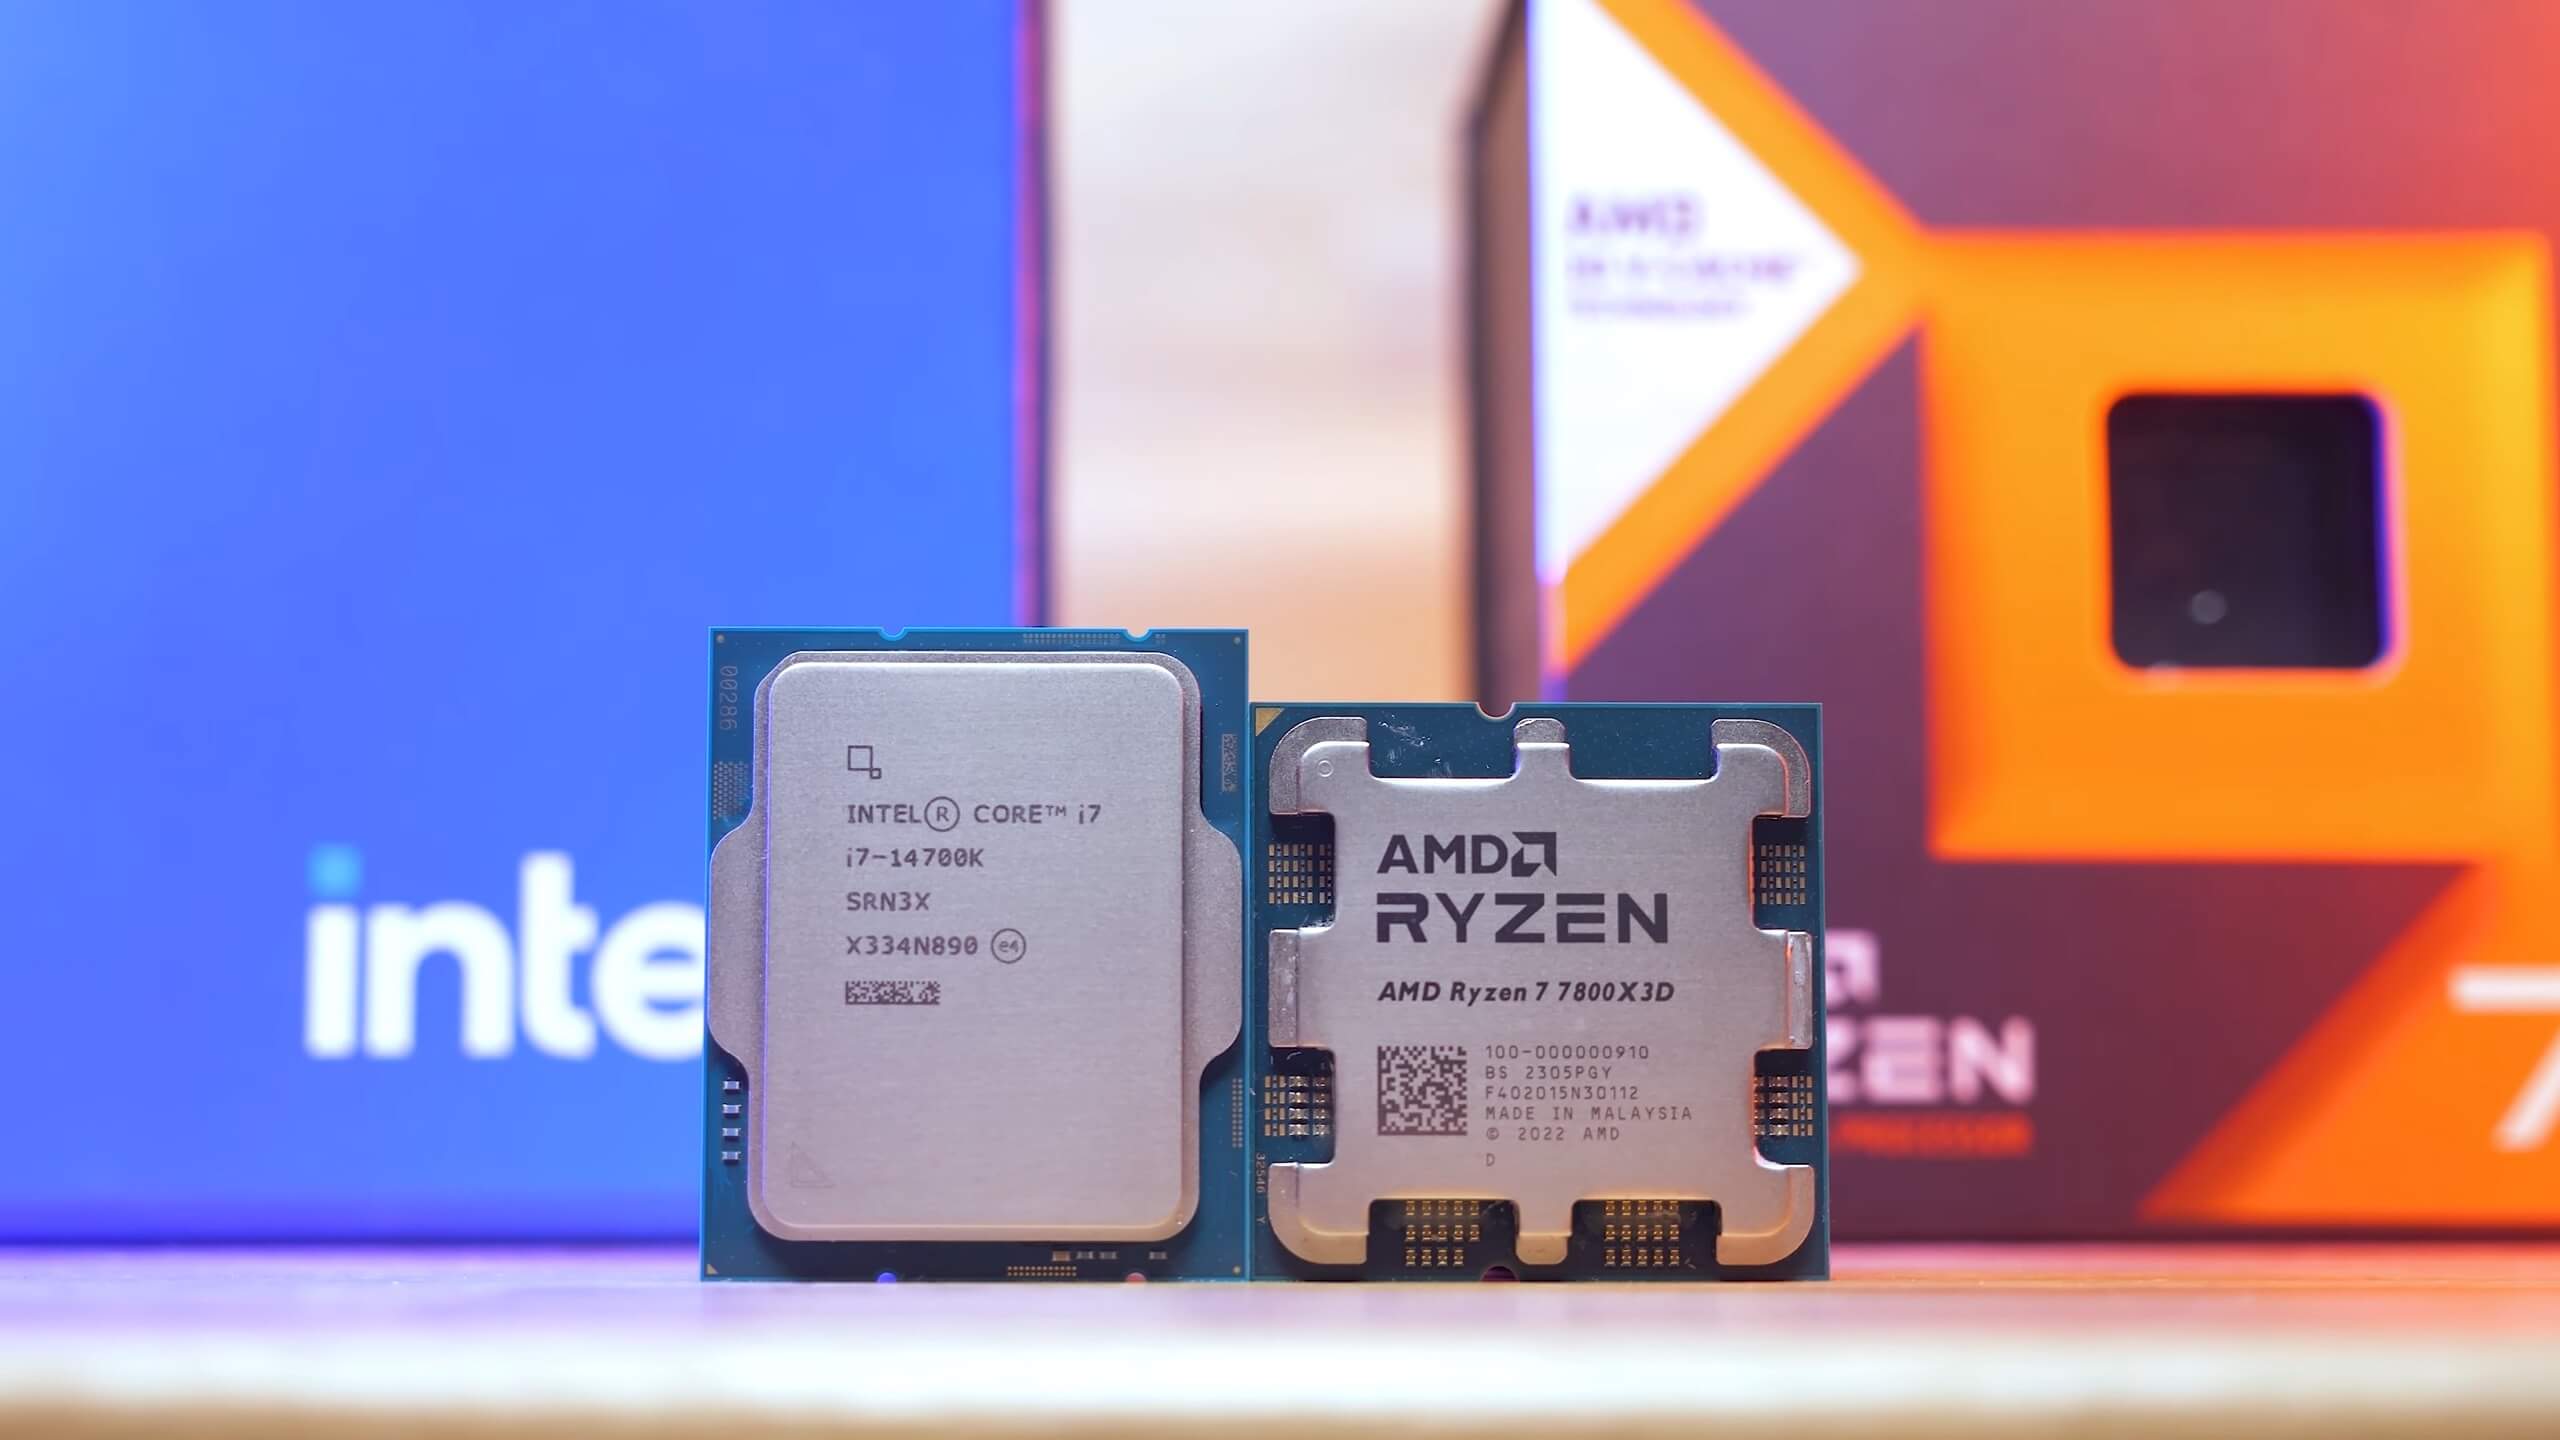
Intel is launching today their latest-gen Core desktop CPUs with three new models: the Core i9-14900K, Core i7-14700K, and Core i5-14600K, all sound familiar and you probably know to an extent what to expect. We have all three on hand for testing today. Now, you might be wondering what Intel’s new 14th generation CPUs have to offer. What makes this “generation” different to the previous generation. So as far as we can tell, almost nothing.
This isn’t a huge surprise though. We’ve known for a while that the 14th-gen Core were going to be a Raptor Lake Refresh, so in other words an update of the previous generation, and this time around that means essentially the exact same chip with a bump in clock frequencies. There’s no IPC improvement here, no real tweaks to the silicon, it’s a pretty straightforward refresh.
The biggest change can be seen when looking at the Core i7-14700K which now has an additional cluster of E-cores, taking the total to 12. The Core i5 still has 8 E-cores and the Core i9 16 E-cores, though they are now clocking 100 MHz higher for the turbo.
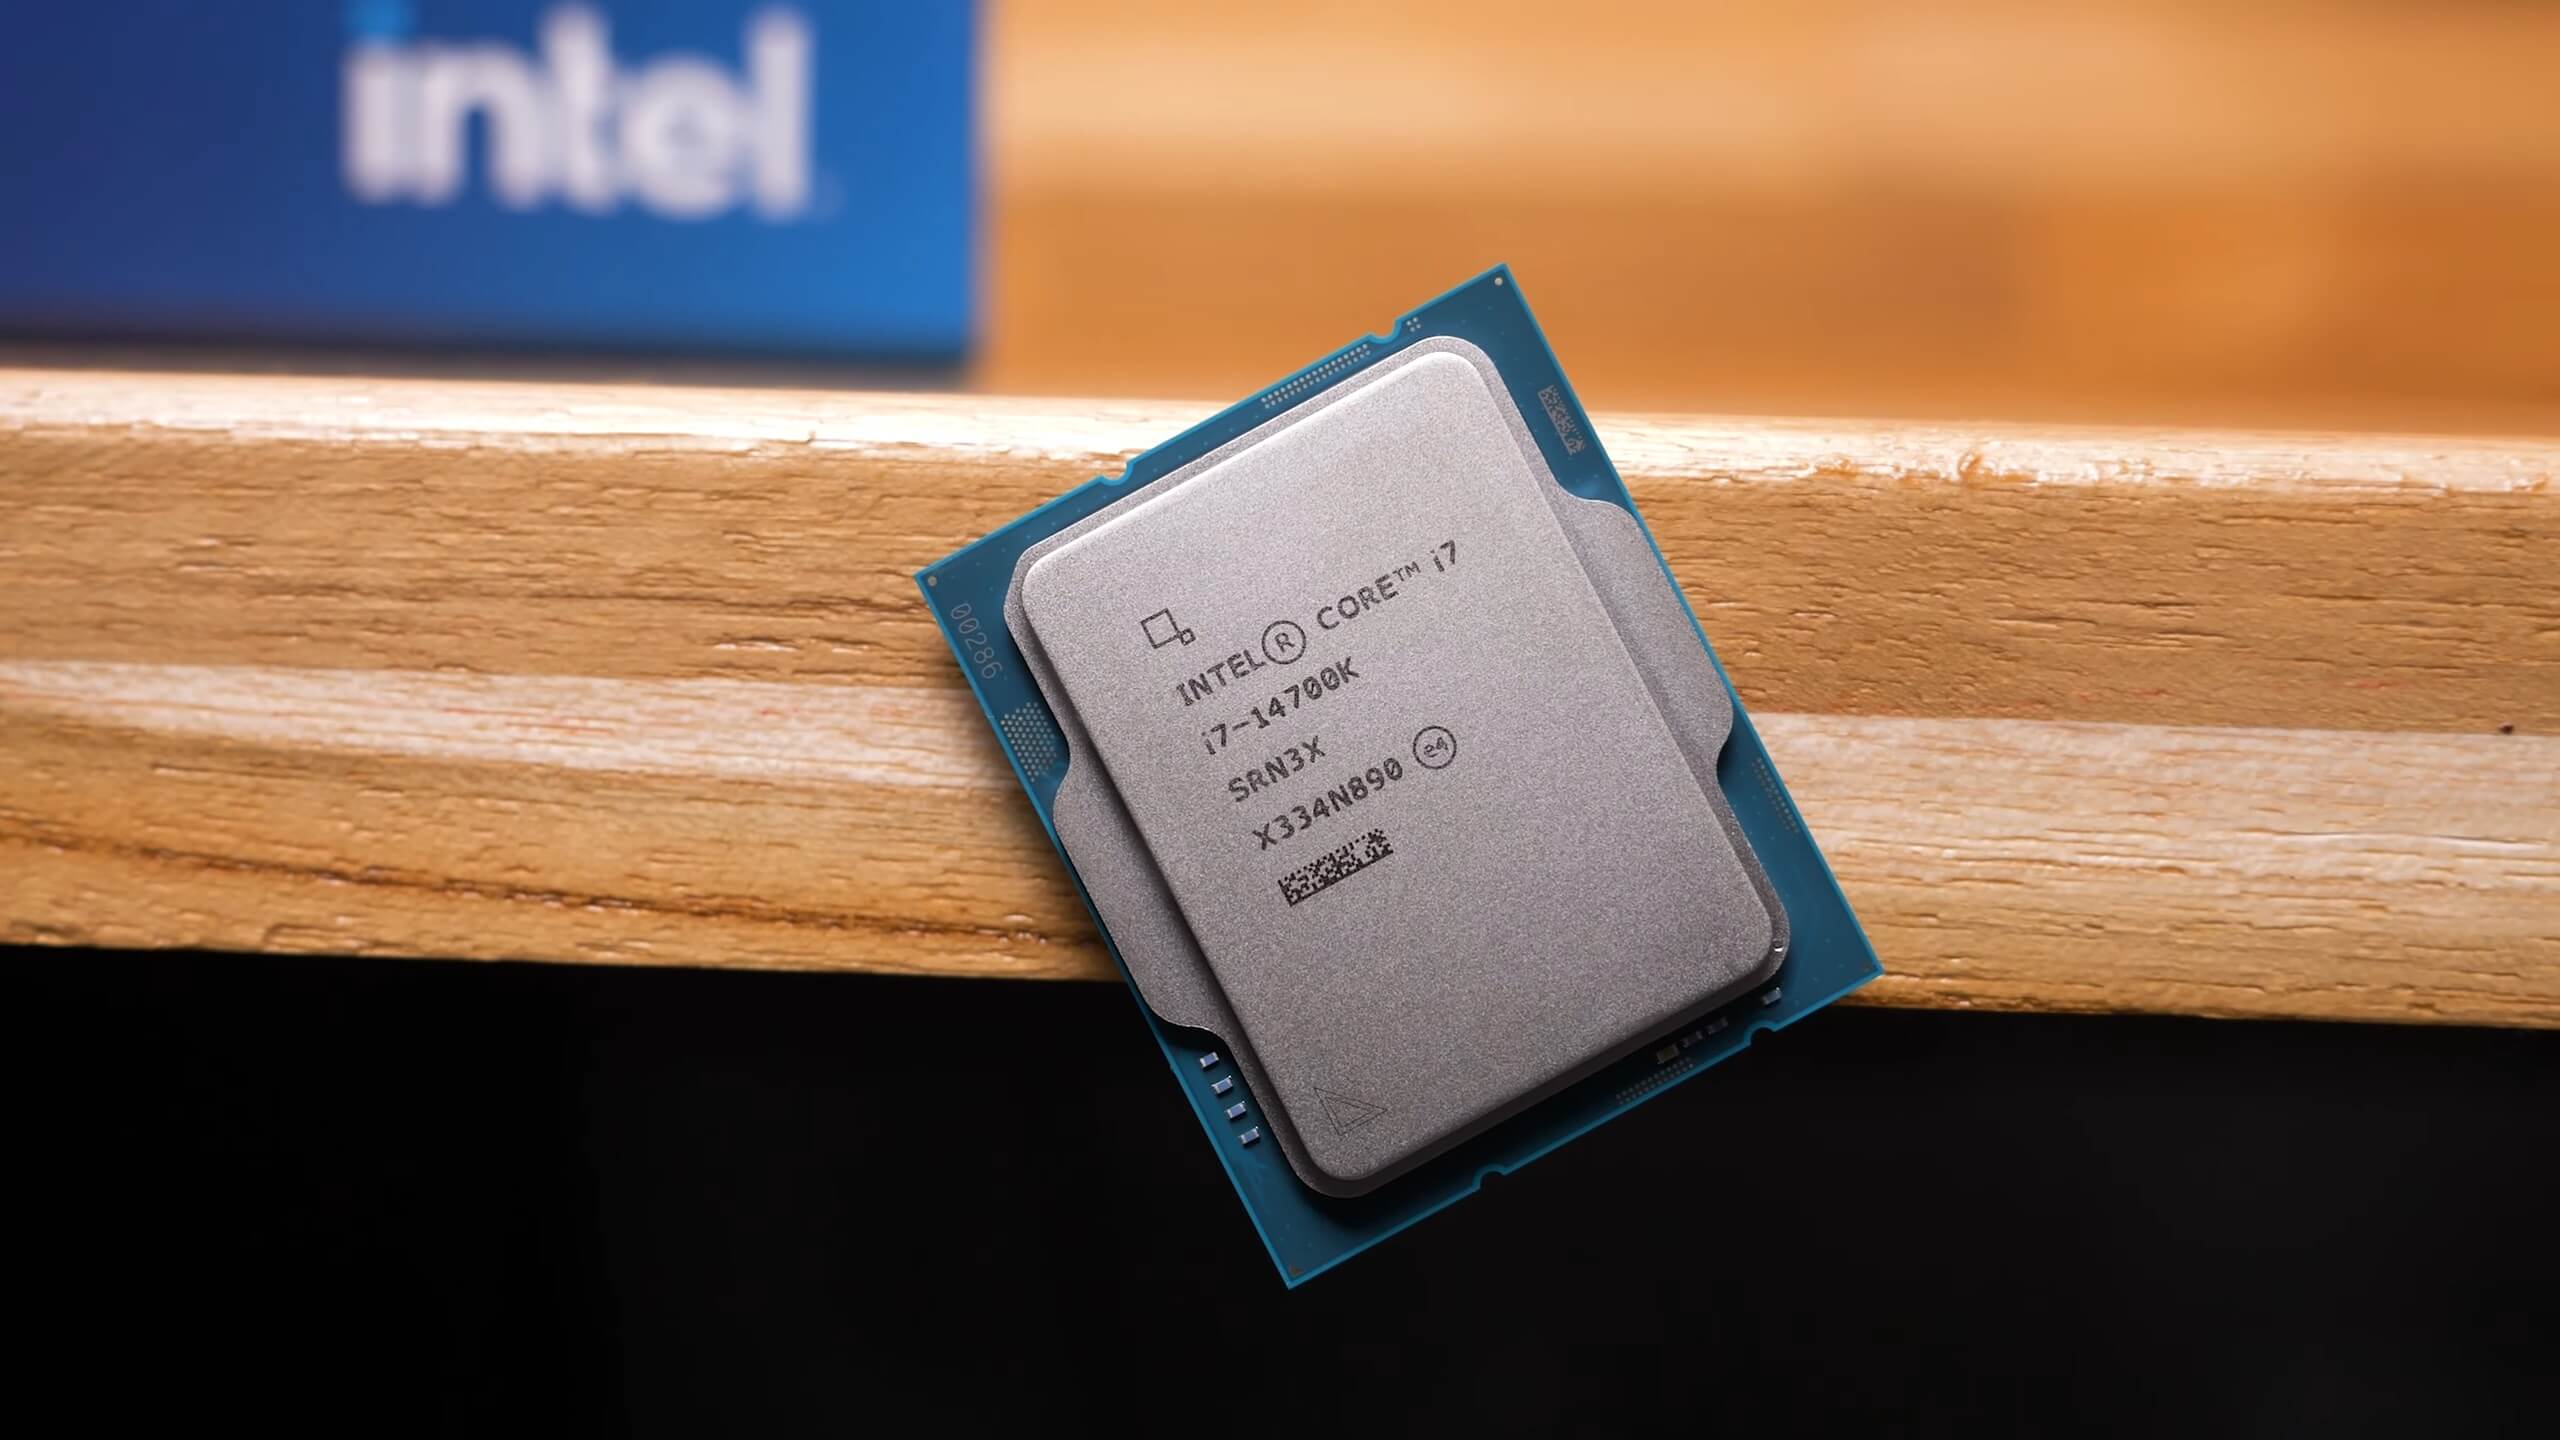
What makes this “generation” different to the previous generation? As far as we can tell, almost nothing.
On paper then the key highlights for the Core i9-14900K include a 3% increase to the peak Turbo frequency and a 2% frequency increase for the E-cores. The 14600K gets a 4% frequency bump for the P-core Turbo and a 2.5% increase for the E-cores. And that’s about it.
Actually, Intel is also claiming some software optimization for the 14th-gen series, which for reasons that almost certainly won’t make sense, are not available for 12th and 13th-gen owners. What the chipmaker is calling “Intel Application Optimization” is a new policy within Intel’s Dynamic Tuning Technology that optimizes performance for select games by directing application resources in real-time. As an example, Intel claims this leads to a 13% uplift in Rainbow Six Siege and a 16% uplift for Metro Exodus.
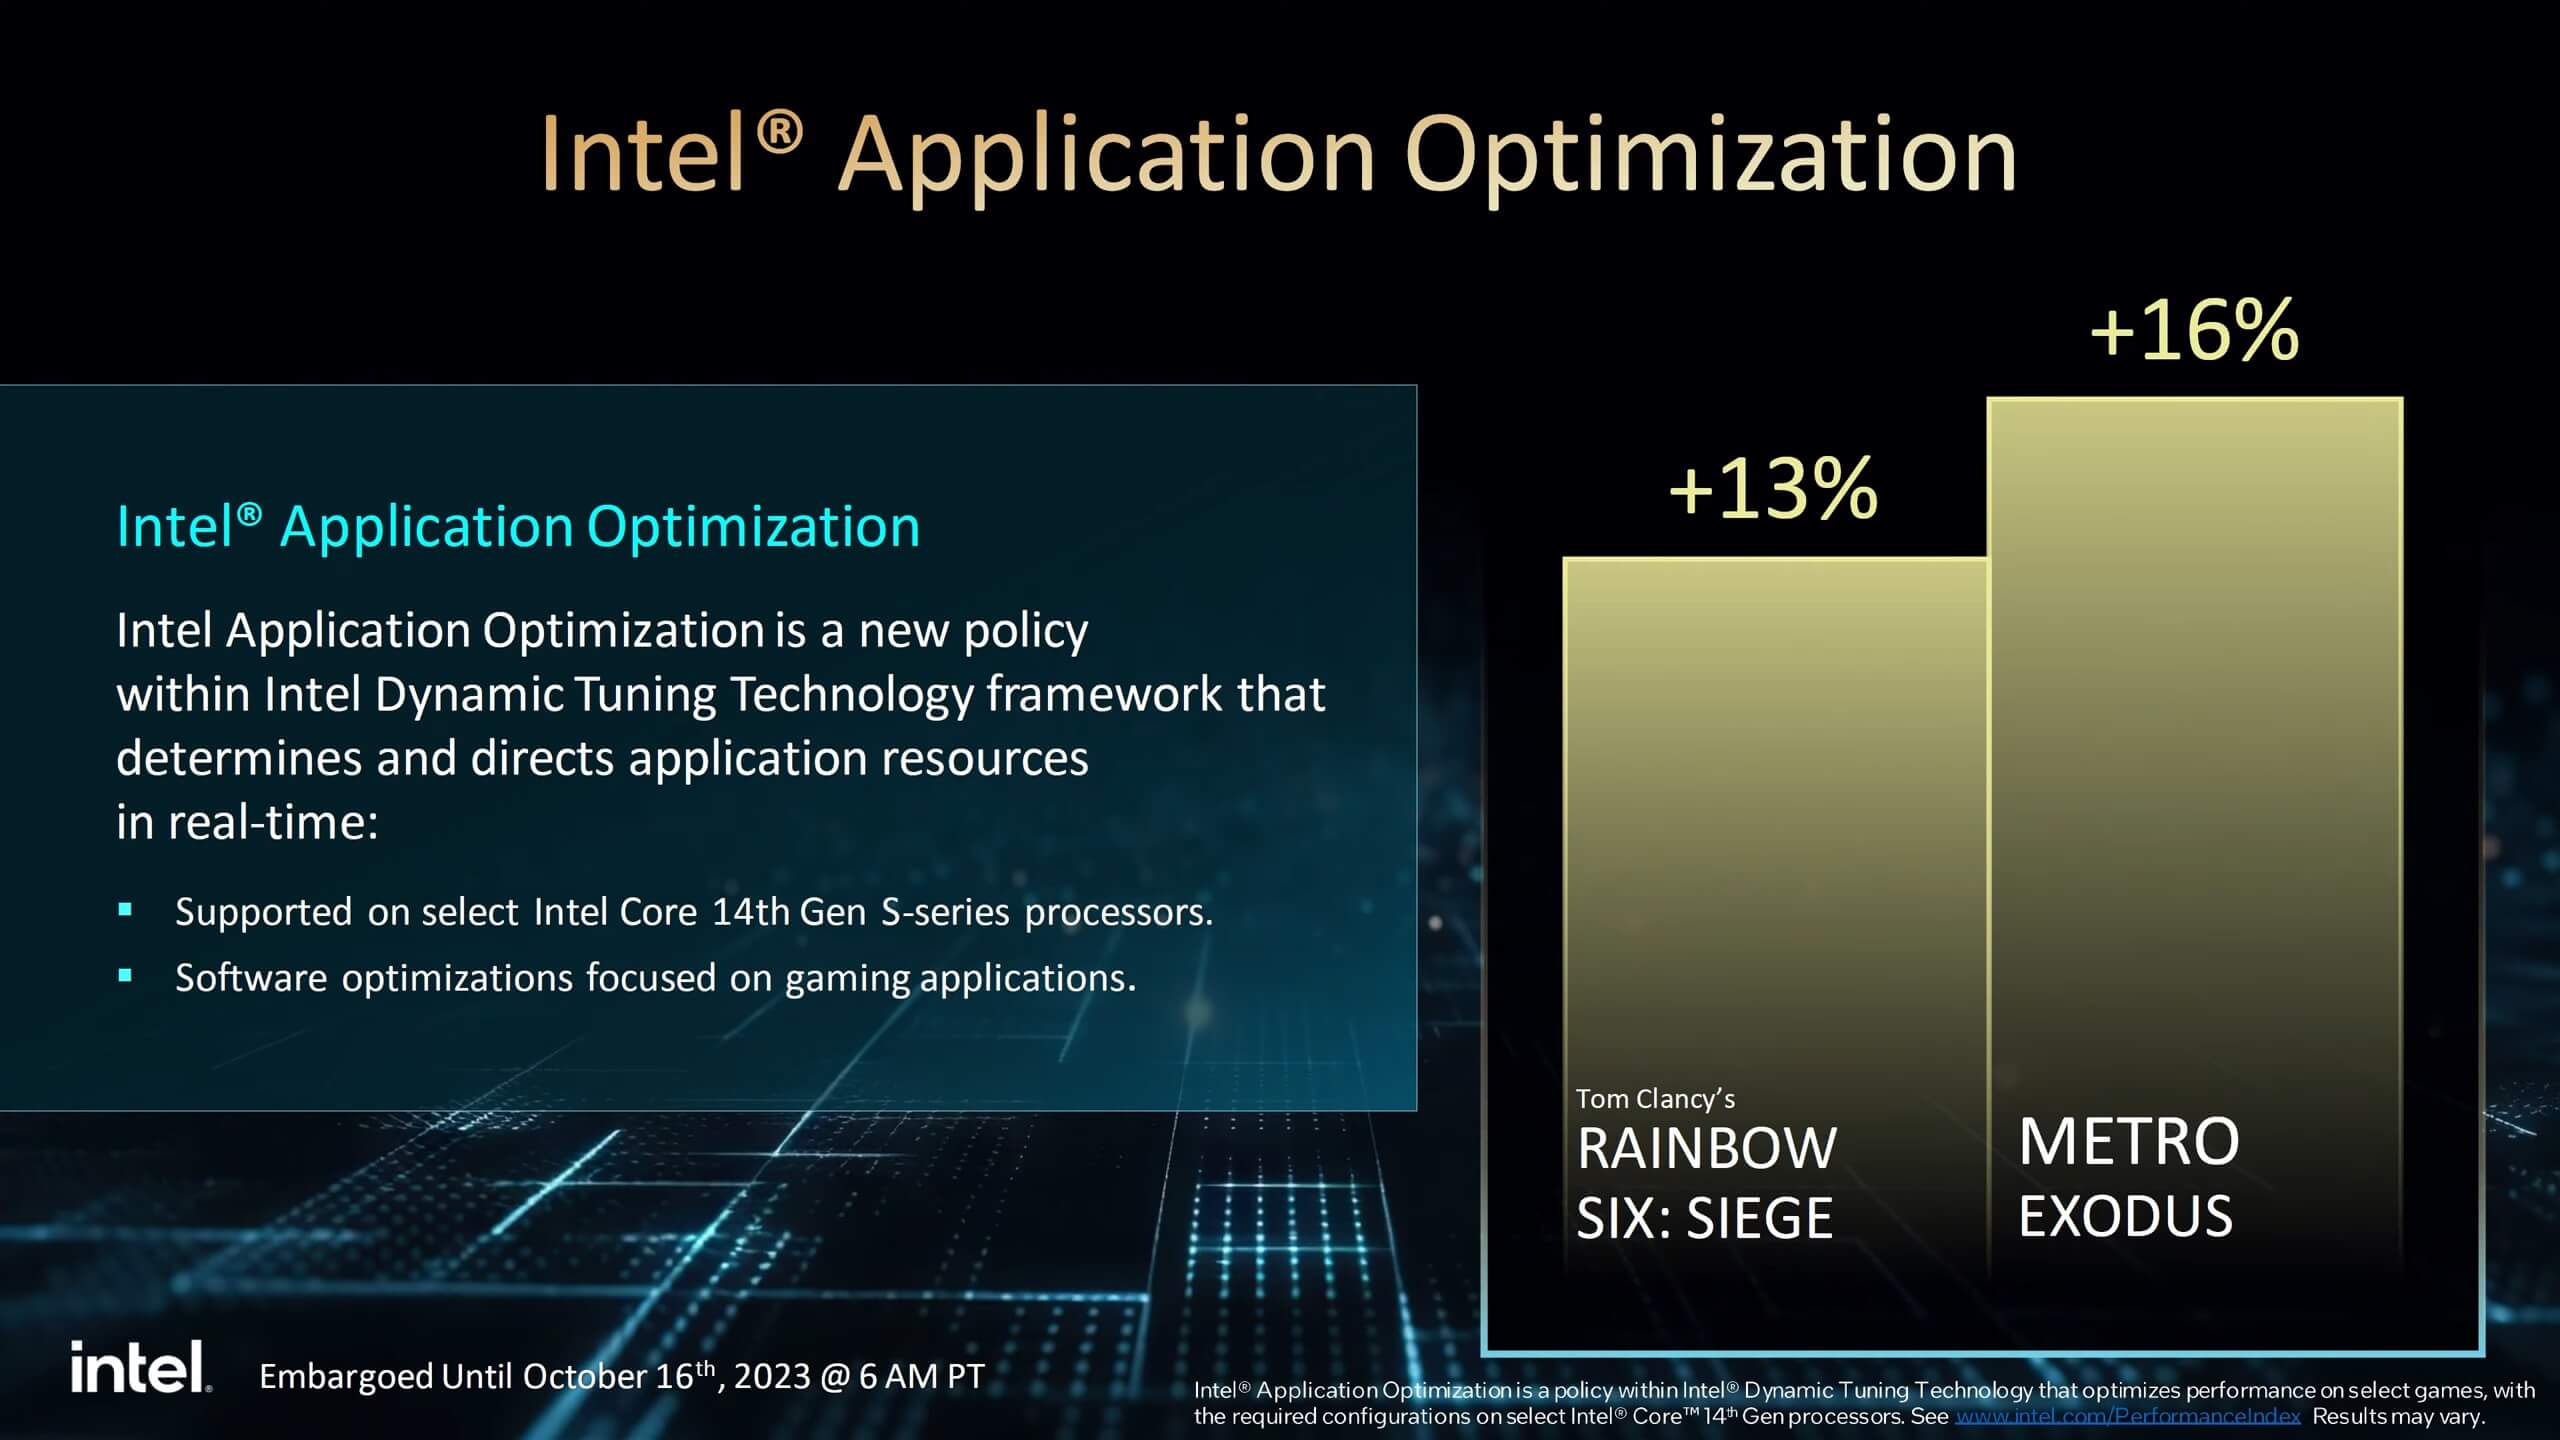
As it stands right now, Rainbow Six Siege and Metro Exodus are the only two games supported by this new feature, though Intel says they are working with developers to add additional titles. The Intel Application Optimization will preload via the Intel Dynamic Tuning driver on motherboards that have DTT enabled in BIOS. But given the very limited support for this, we won’t be testing it today as neither of these games are included in our sample of benchmarks.
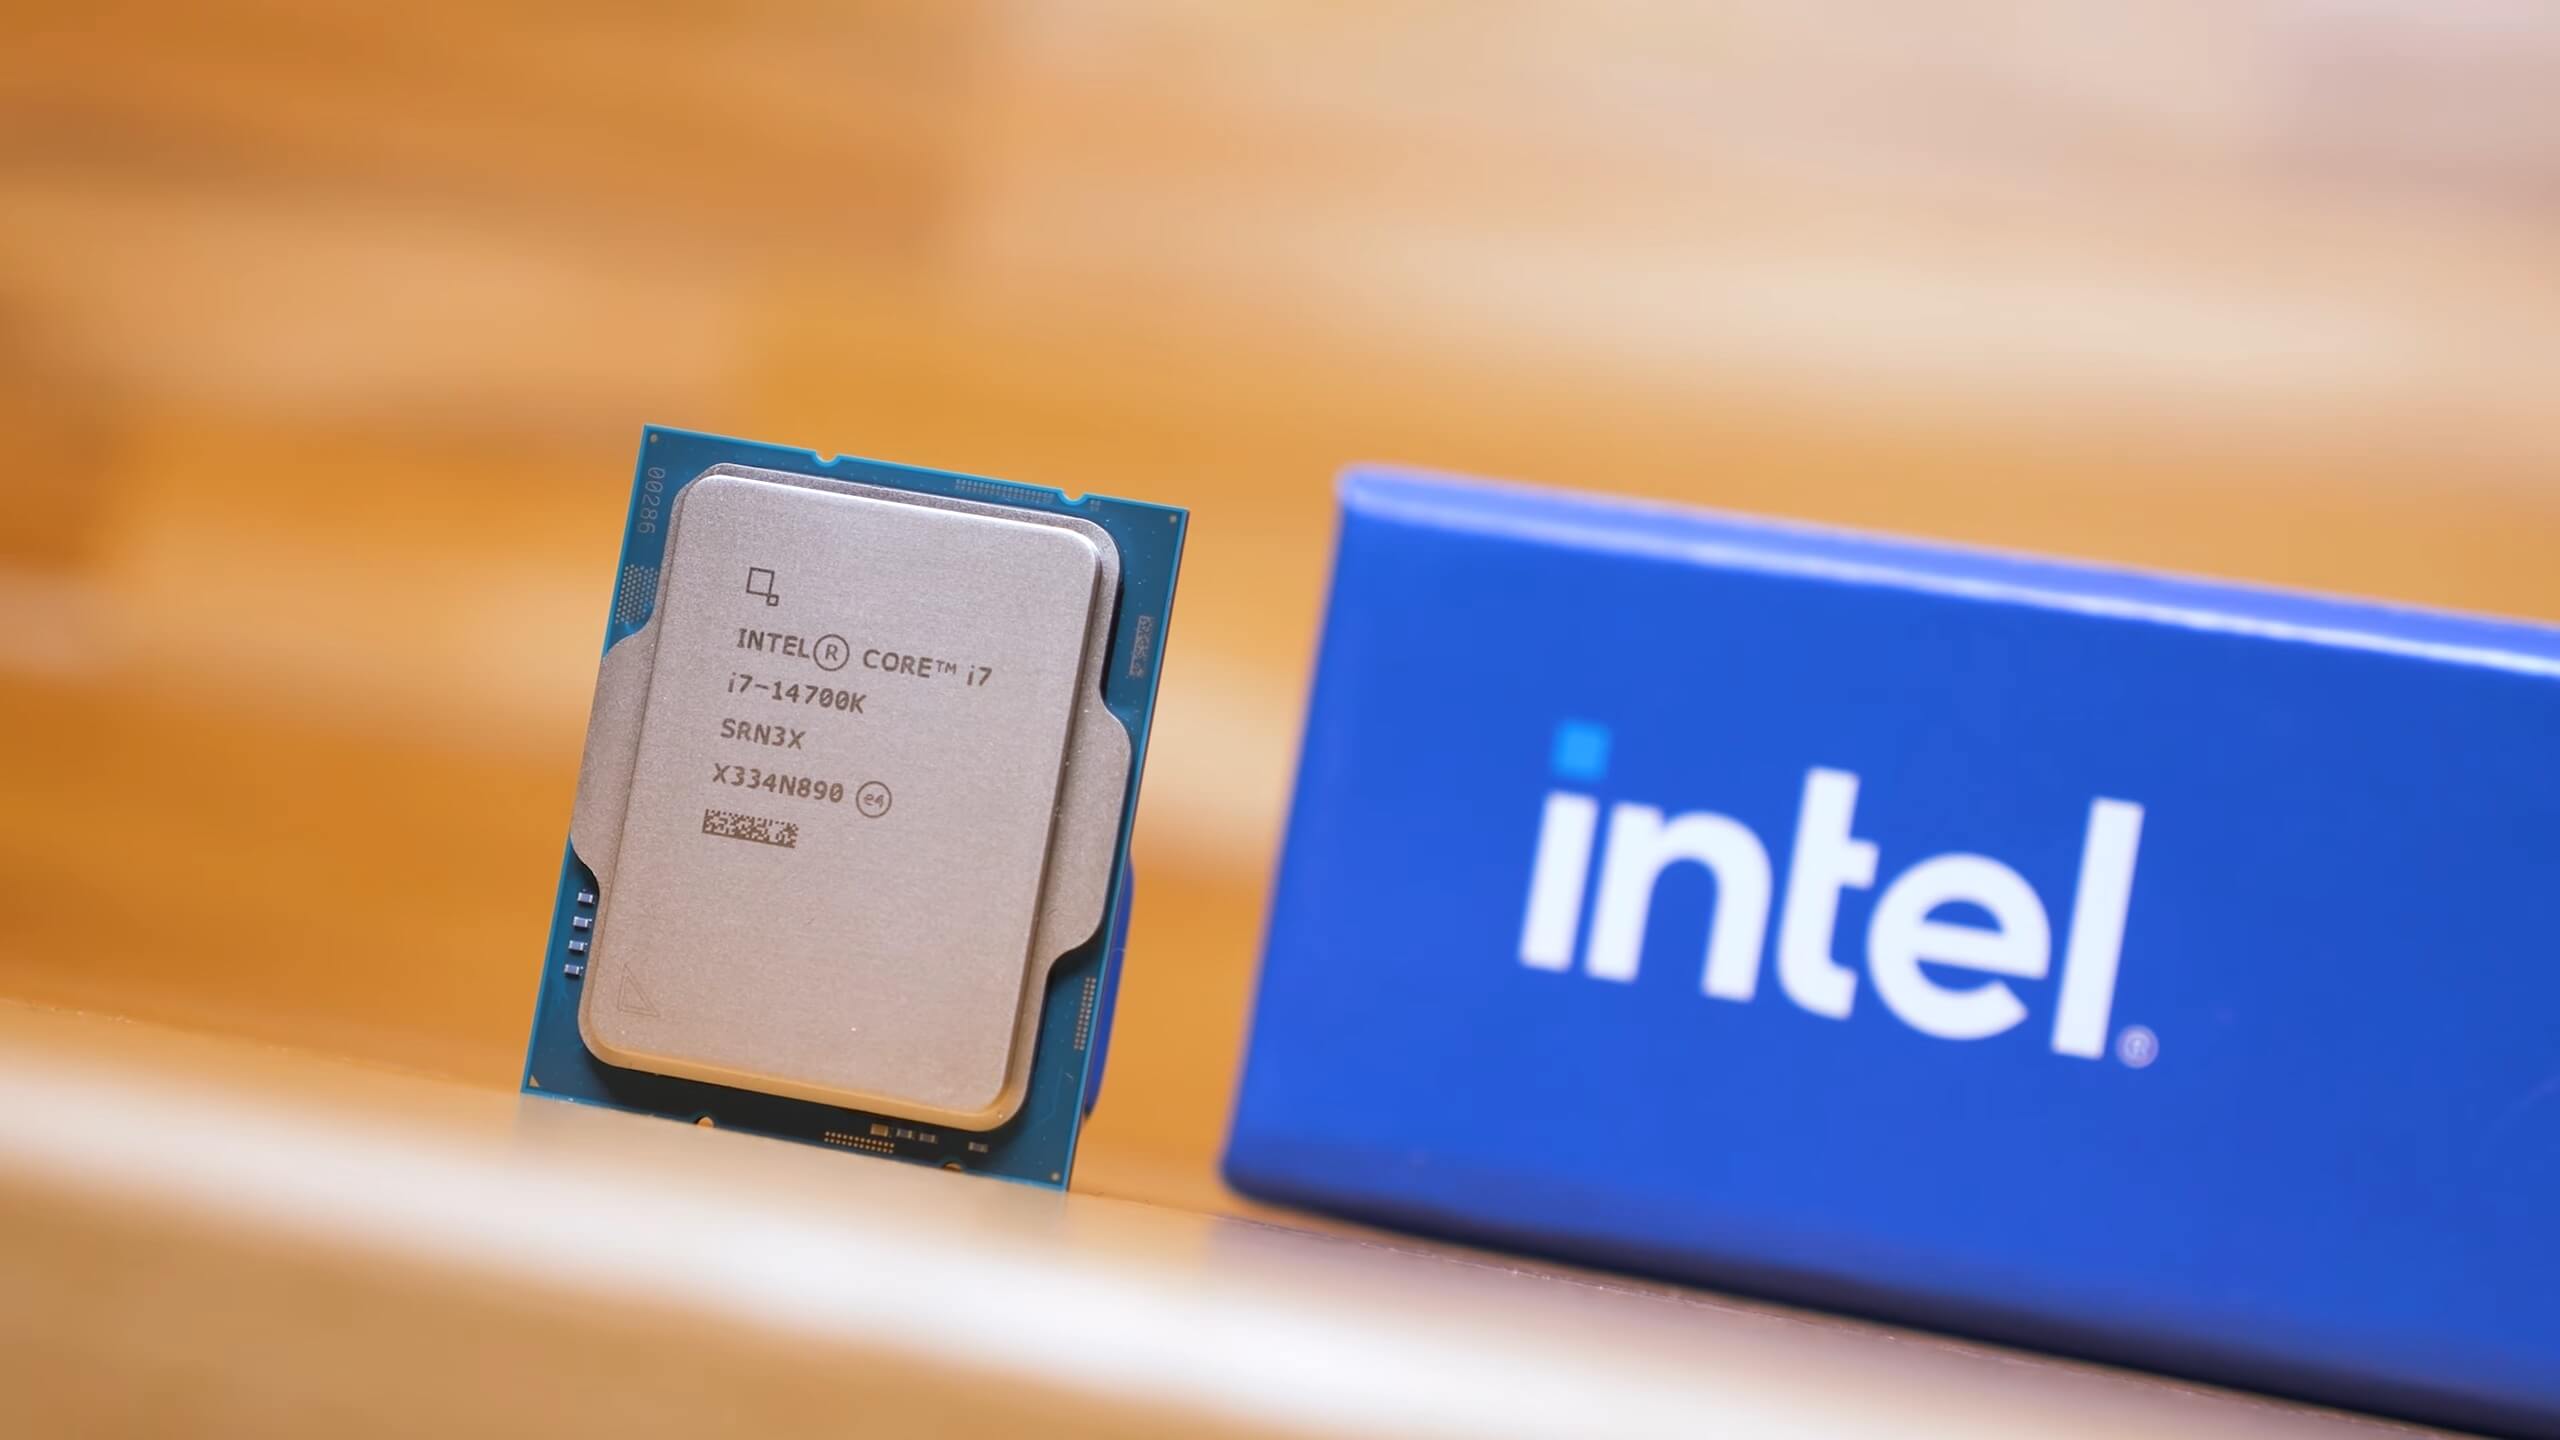
In short, this is Intel’s attempt to steal back the gaming performance crown from AMD, and that appears to be the primary focus of the 14th-gen series, outside of the Core i7 getting a few more E-Cores.
For testing, we’re using an Asus ROG Strix RTX 4090 graphics card running Game Ready Driver version 644.43. All the benchmark data in this review is fresh, recorded in the last week, up to date using the latest BIOS revisions, Windows 11 release, drivers, and so on. The LGA1700 processors were tested using DDR5-7200 CL34 memory and the AM5 processors with DDR5-6000 CL30 memory. Let’s get into the testing…
Application Benchmarks
Starting with the Cinebench multi-core test, we find exactly what we were expecting based on the paper spec. The 14900K is identical to the 13900K as both throttle to the same frequency after 10 minutes of load. The 14700K offers a 19% boost over the 13700K due to a 50% increase in E-Cores, bringing it much closer to AMD’s 7950X.

Next, we observe that the 14600K is 7% faster than the 13600K in this test. The slight increase in clock speeds helps here, as this model doesn’t thermal throttle using a 360mm AIO, which is a positive.
However, the power consumption raises concerns. We’ll delve into power usage during gaming later, but we decided to record the average power usage for the CPUs covered in this review. The results are surprising: the 14900K averages a total system consumption of 533 watts, almost 50% more than the 7950X for similar performance and nearly double the power of the 7950X3D with a 92% increase for just 5% additional performance.
The 14700K isn’t much better, with total system usage averaging 471 watts, representing a 70% increase over the 7950X3D for 6% less performance. Meanwhile, the 14600K system consumes 310 watts, making it relatively efficient compared to the 7700X, as it uses 17% more power for almost 30% increased performance.
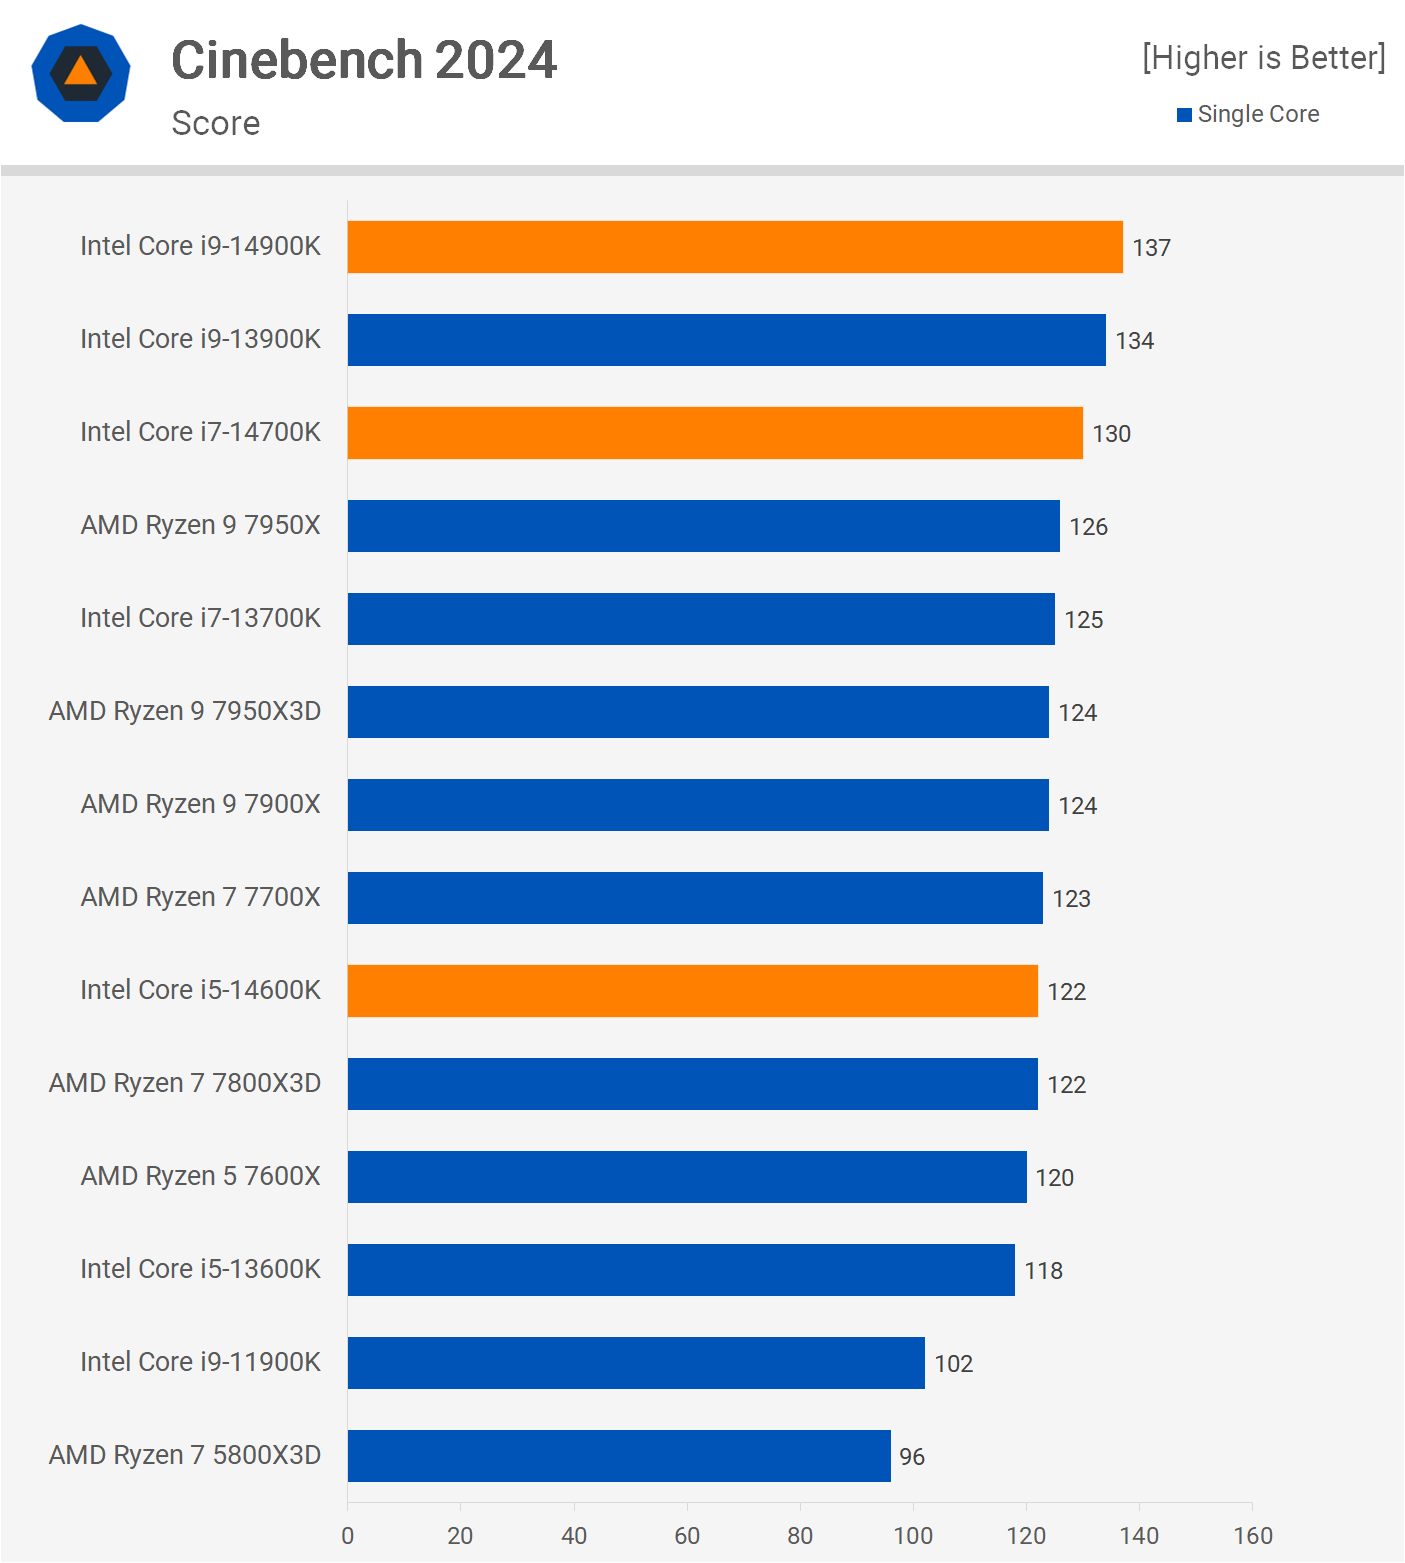
For single core performance, there’s a modest 2% increase for the 14900K over the 13900K. The 14700K is 4% faster than the 13700K, and the 14600K is 3% faster than the 13600K, aligning with expectations based on clock speeds.
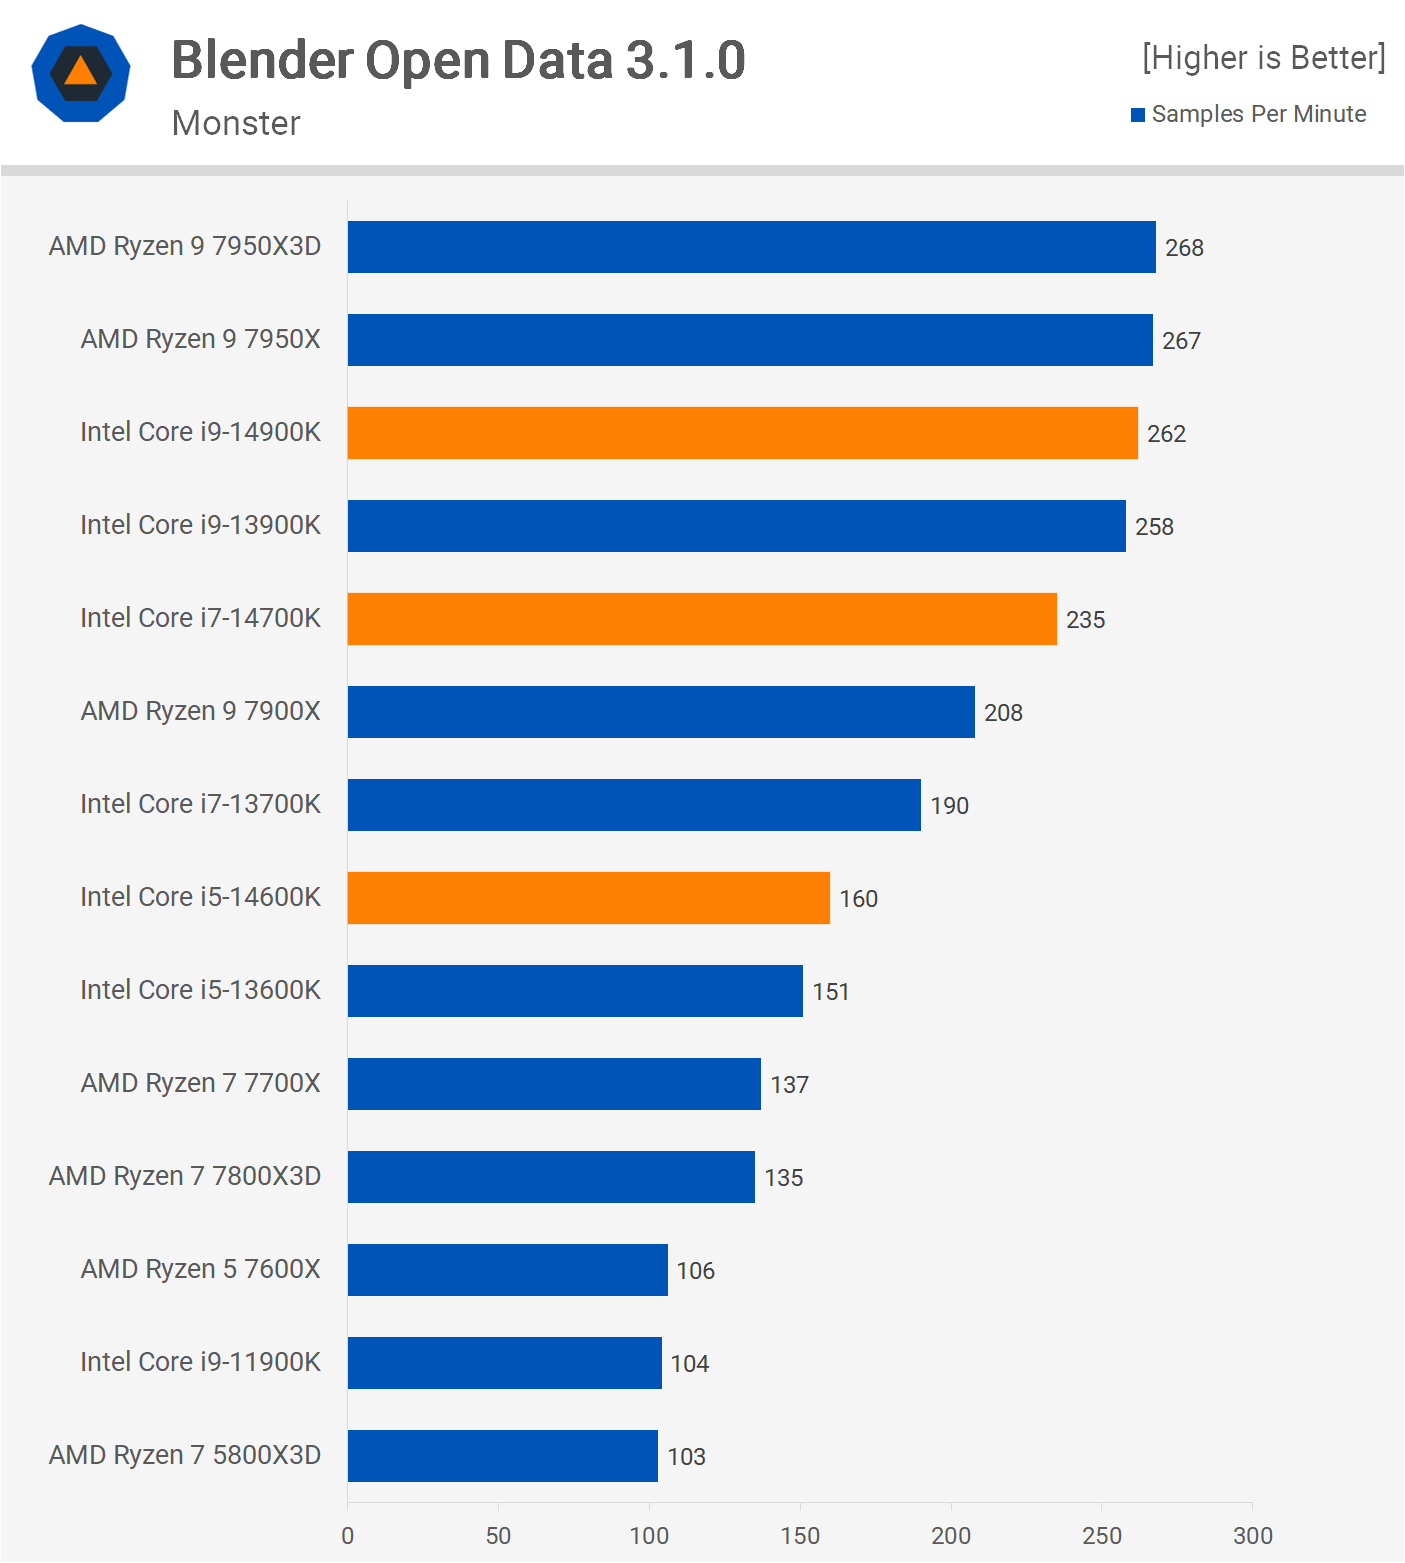
The Blender Open Data benchmark aligns with our Cinebench findings. The performance of the 14900K matches the 13900K. The 14700K, with its additional E-cores, is 24% faster than the 13700K. This is the only significant improvement, as the 14600K is only 6% faster than the 13600K.
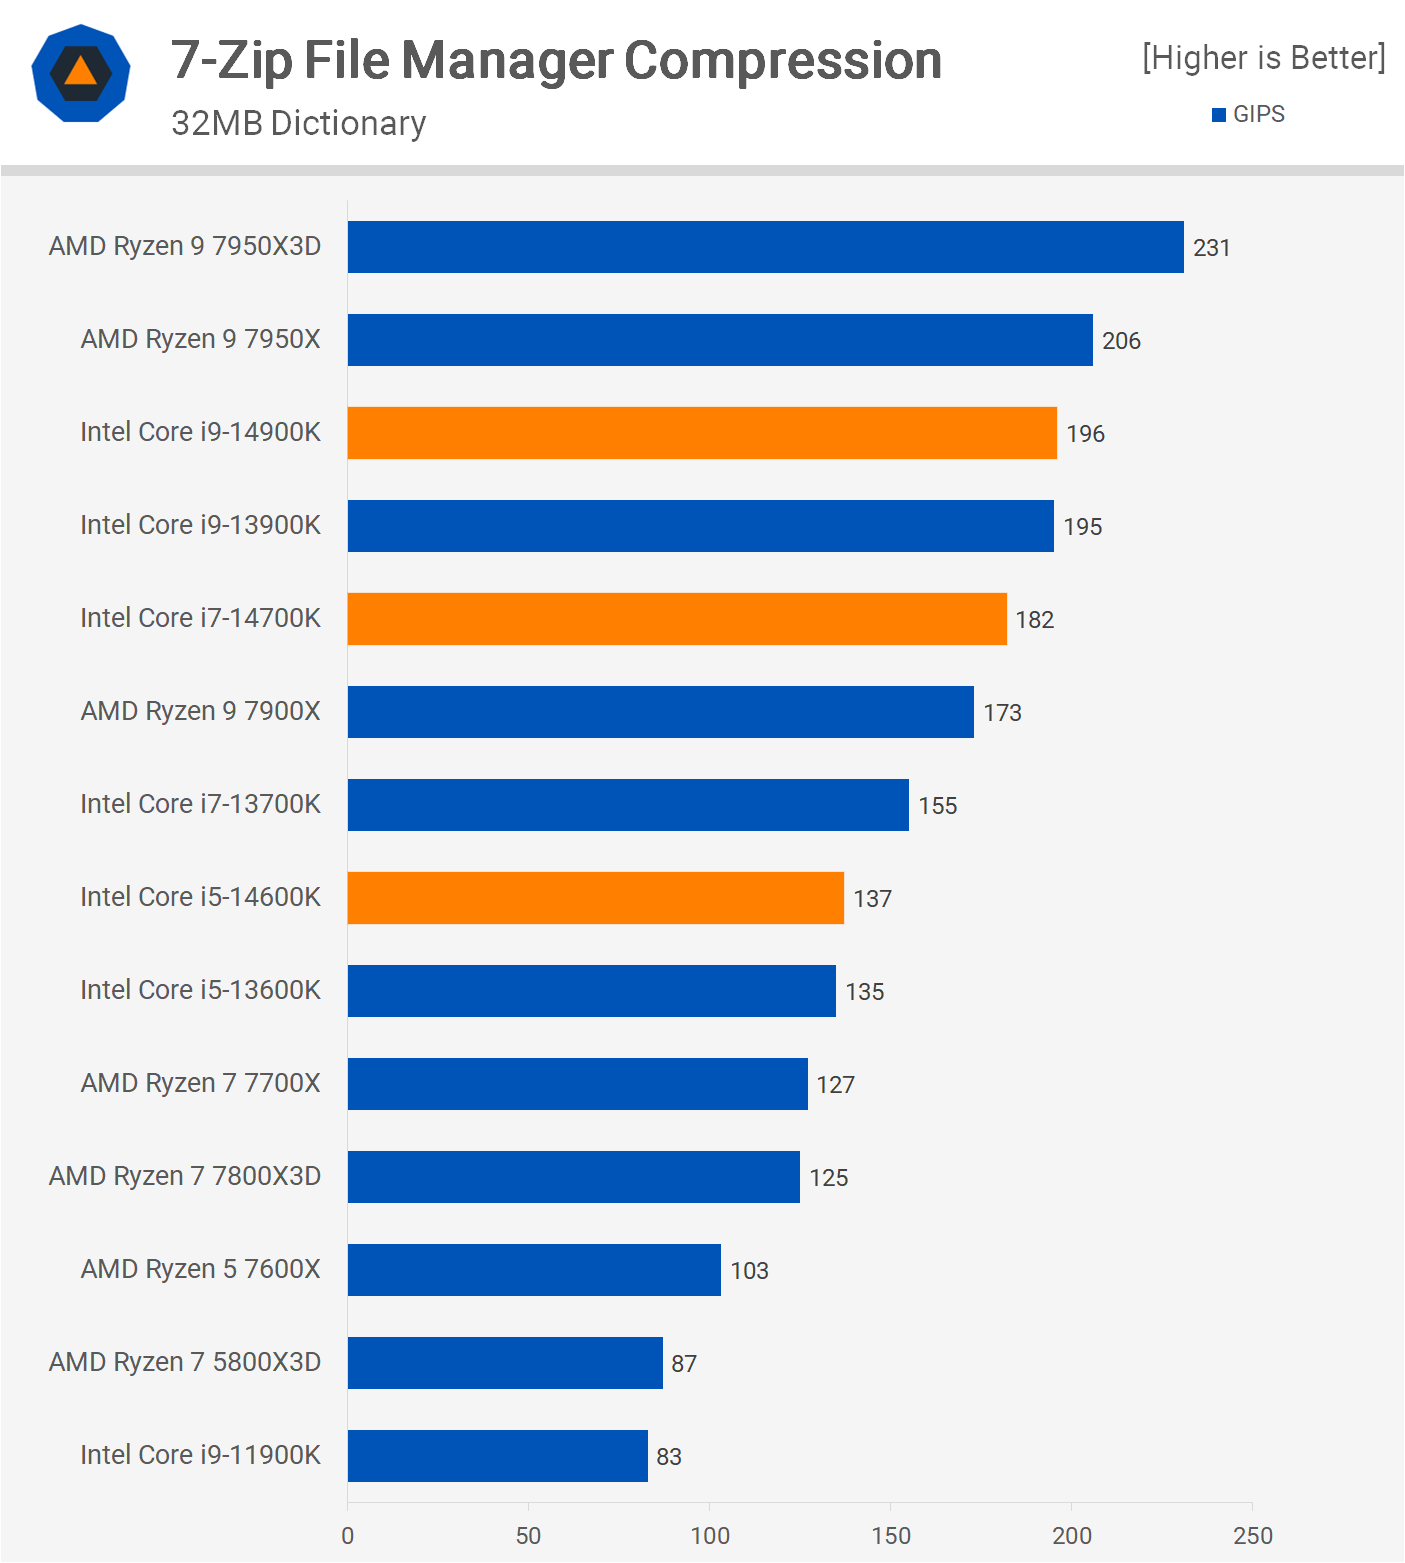
In 7-zip compression, the Core i9’s and Core i5’s show almost identical performance, while the 14700K is 17% faster than the 13700K.
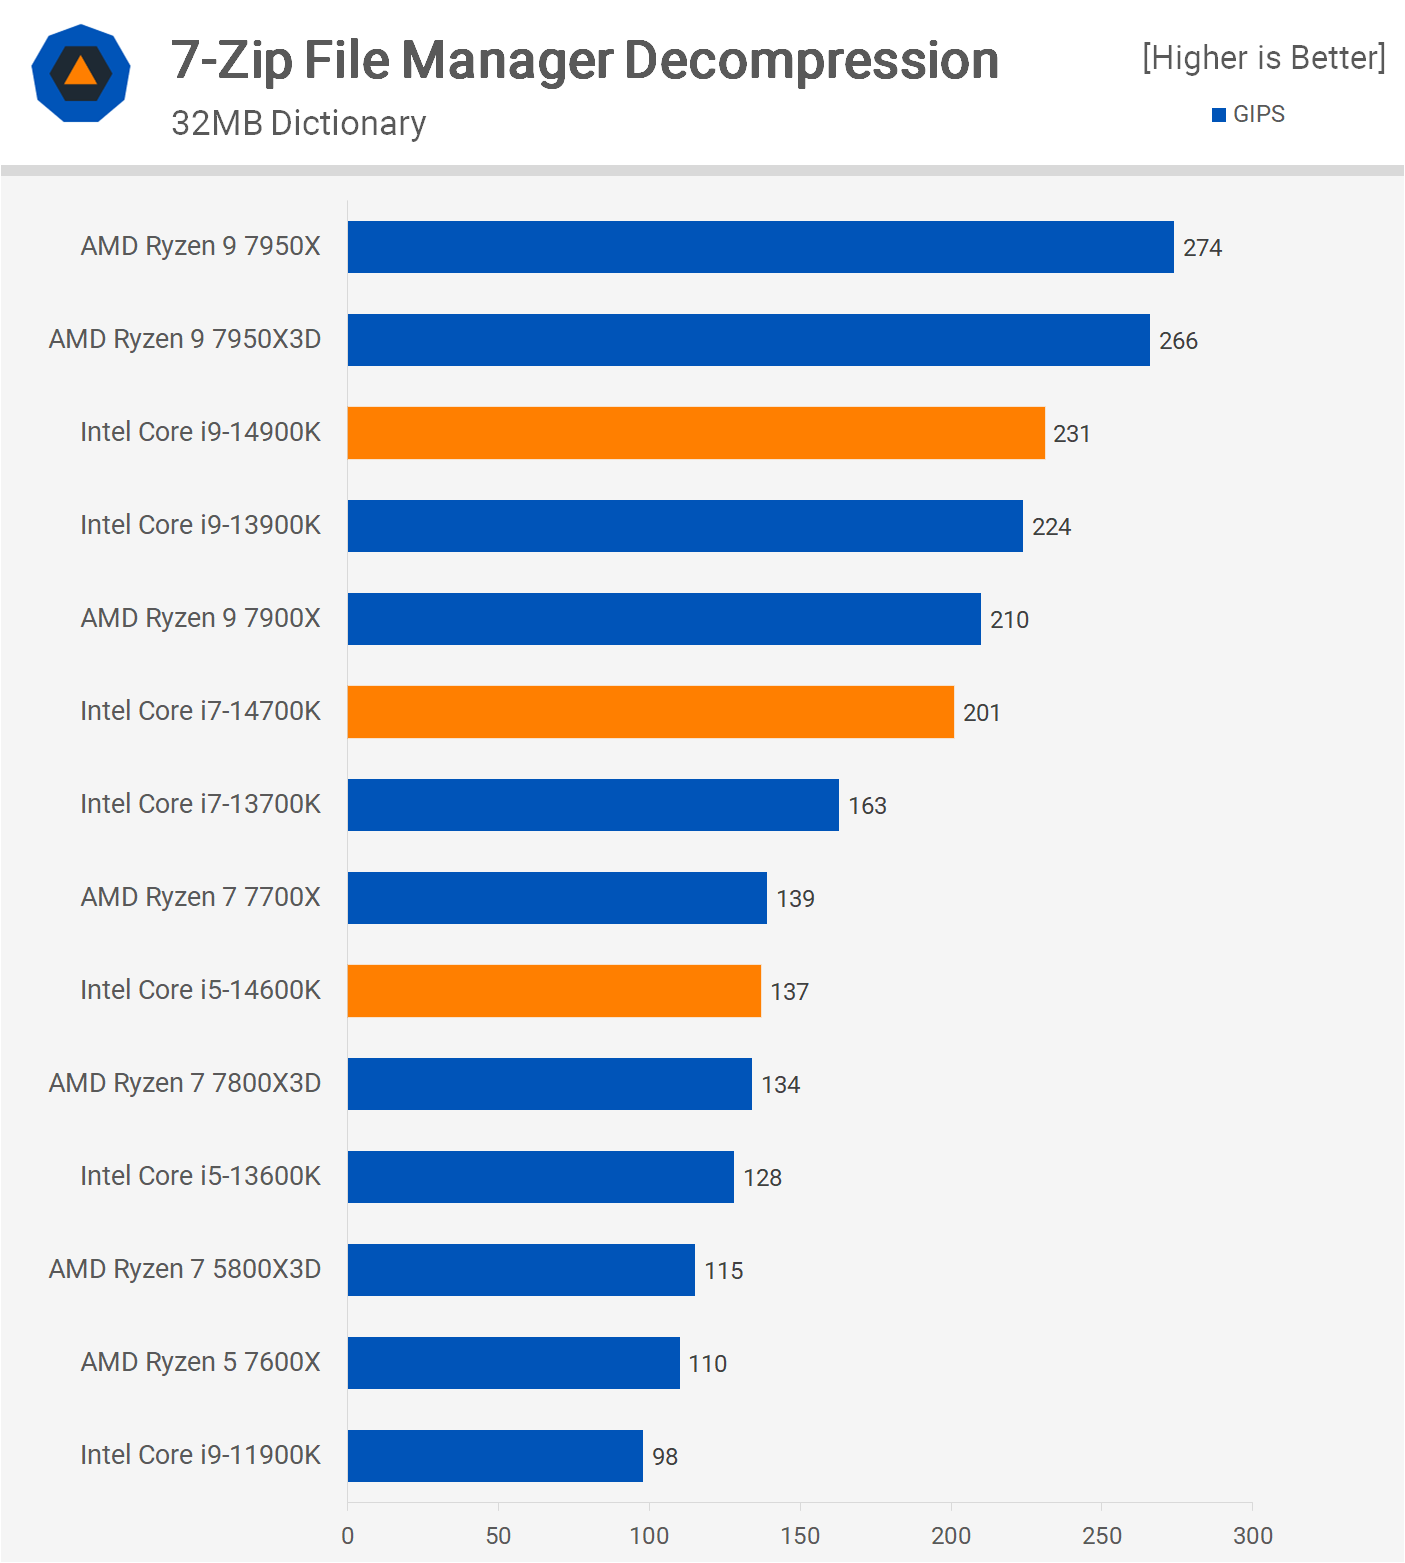
Decompression results mirror the compression findings: the 14900K is 3% faster than the 13900K, the 14600K is 7% faster than the 13600K, and the 14700K is 23% faster than the 13700K, attributed to the addition of four more E-Cores.
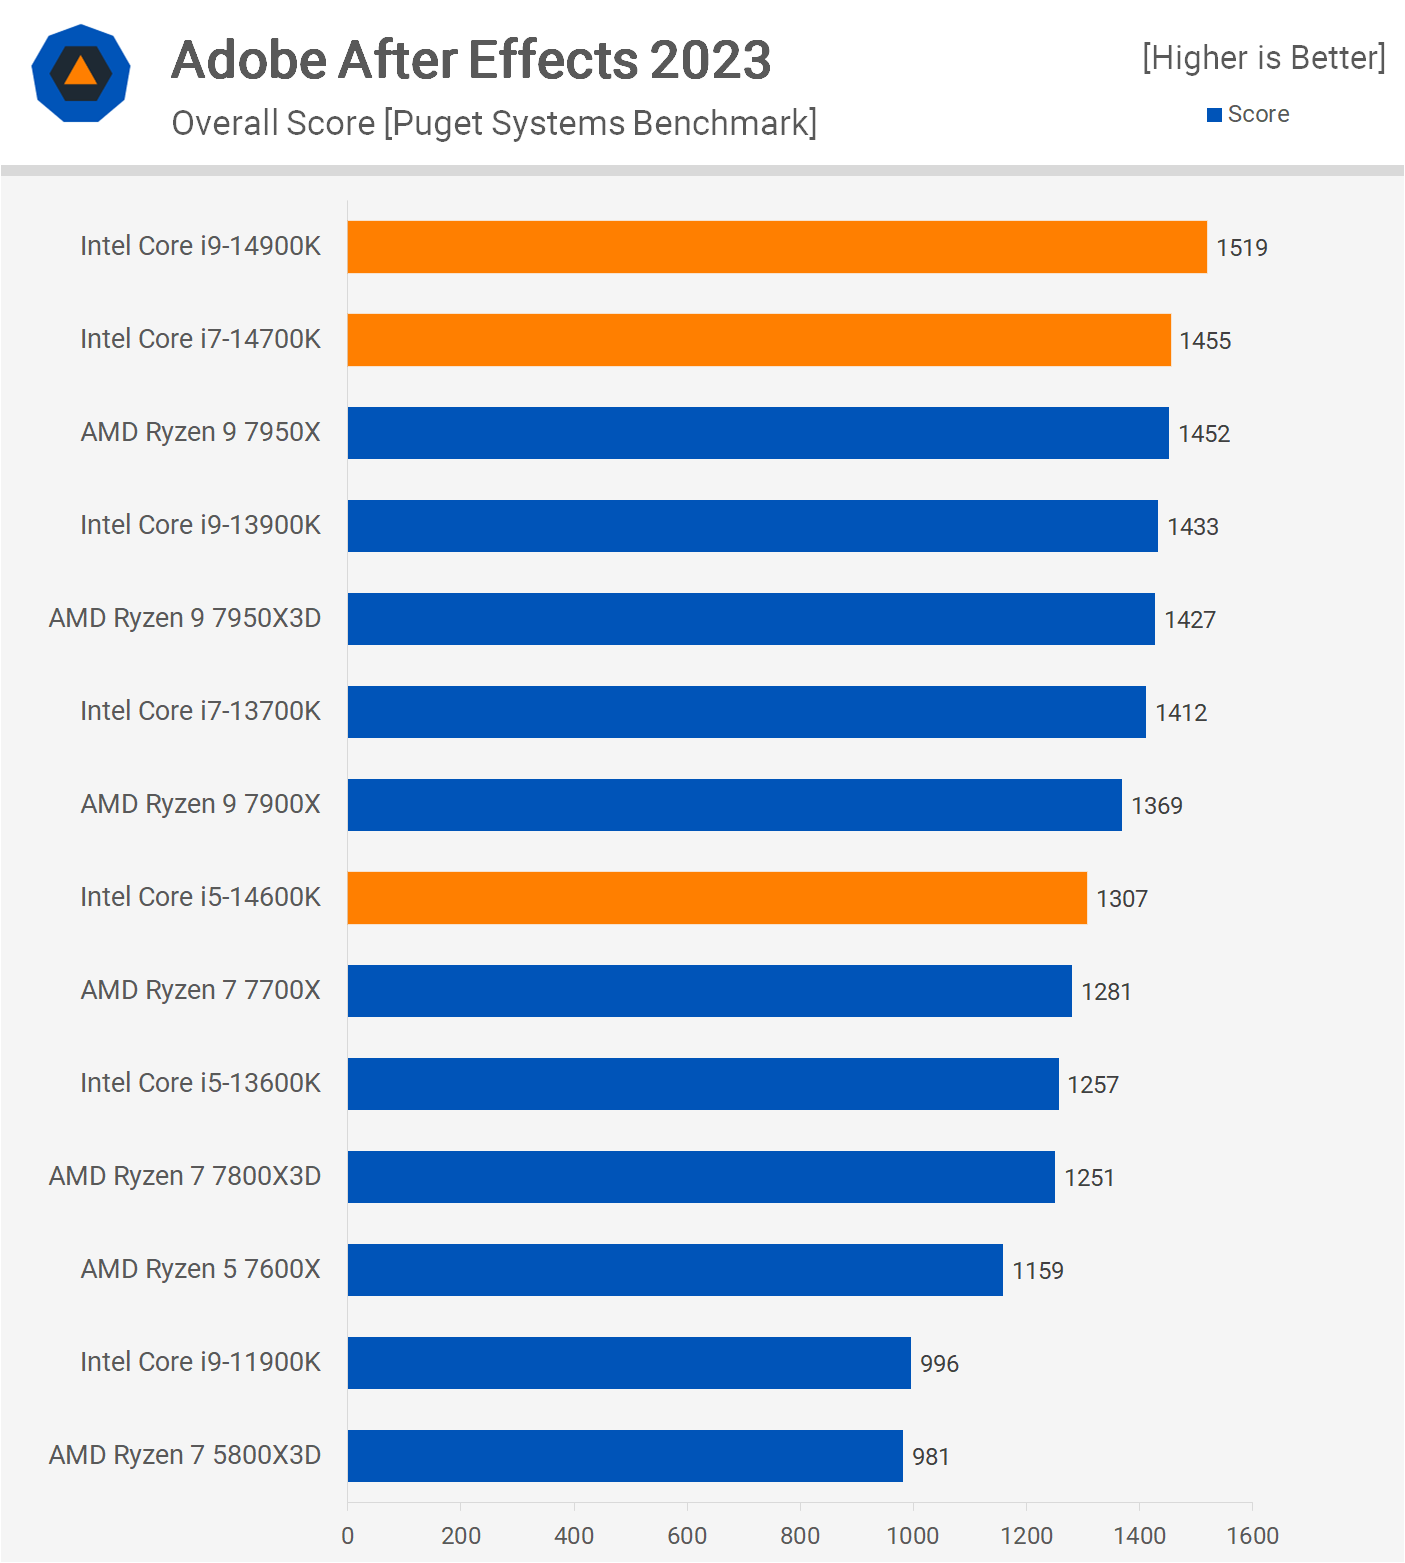
After Effects gives the 14900K a 6% edge over the 13900K. The 14600K is 4% faster than the 13600K, and the 14700K is 3% faster than the 13700K since E-cores don’t make a difference here.

In Photoshop, which mainly utilizes P-cores, the 14900K is 4% faster than the 13900K. The i7 outpaces its predecessor by 6%, and the i5 by 7%.
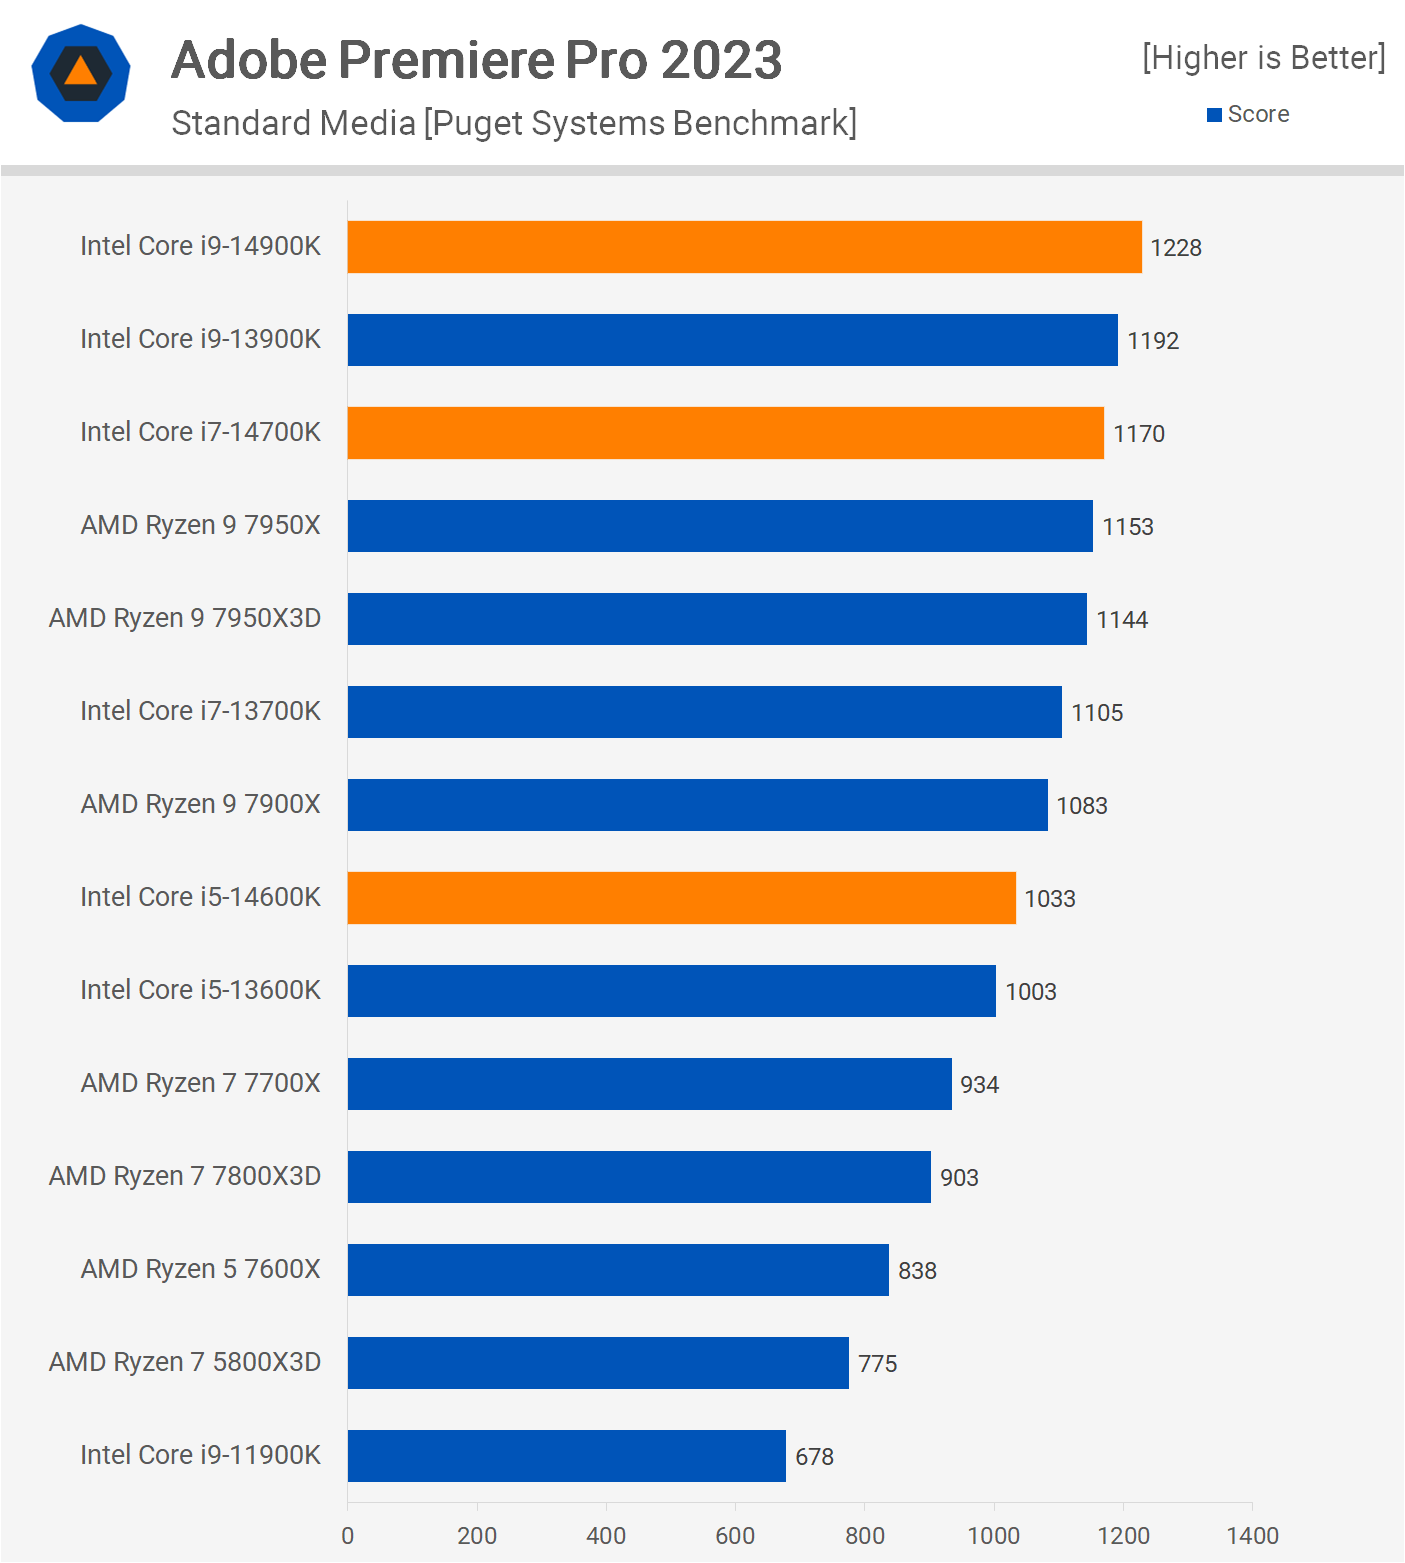
In Premiere Pro, the 14900K is 3% faster than the 13900K, and the 14700K is 6% faster than the 13700K. The Core i5 performance is also modest, with just a 3% improvement over the 13th gen model.
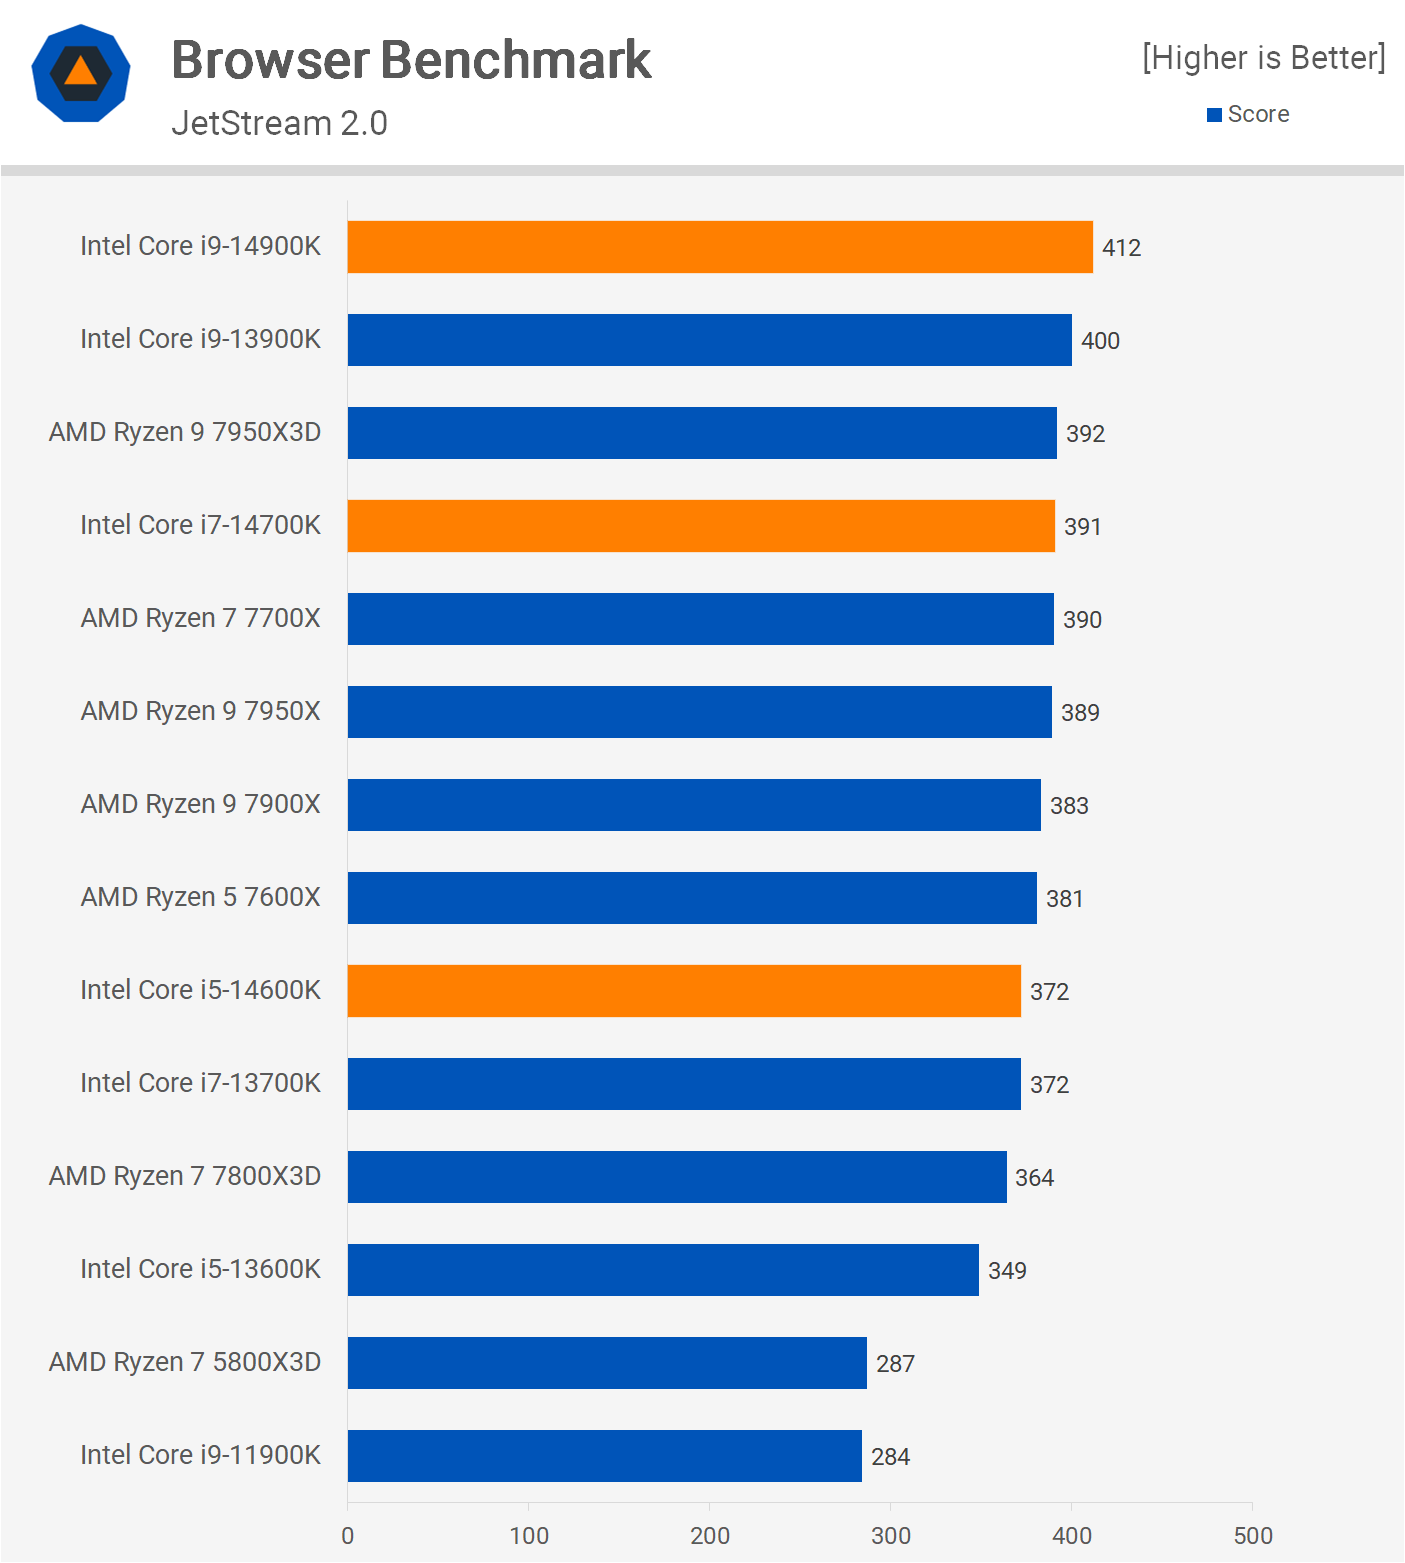
Our final application test is a browser benchmark, reflecting more general usage. The results are consistent: the 14th gen i9 offers a 3% increase, 5% for the i7, and 7% for the i5.
Gaming Benchmarks
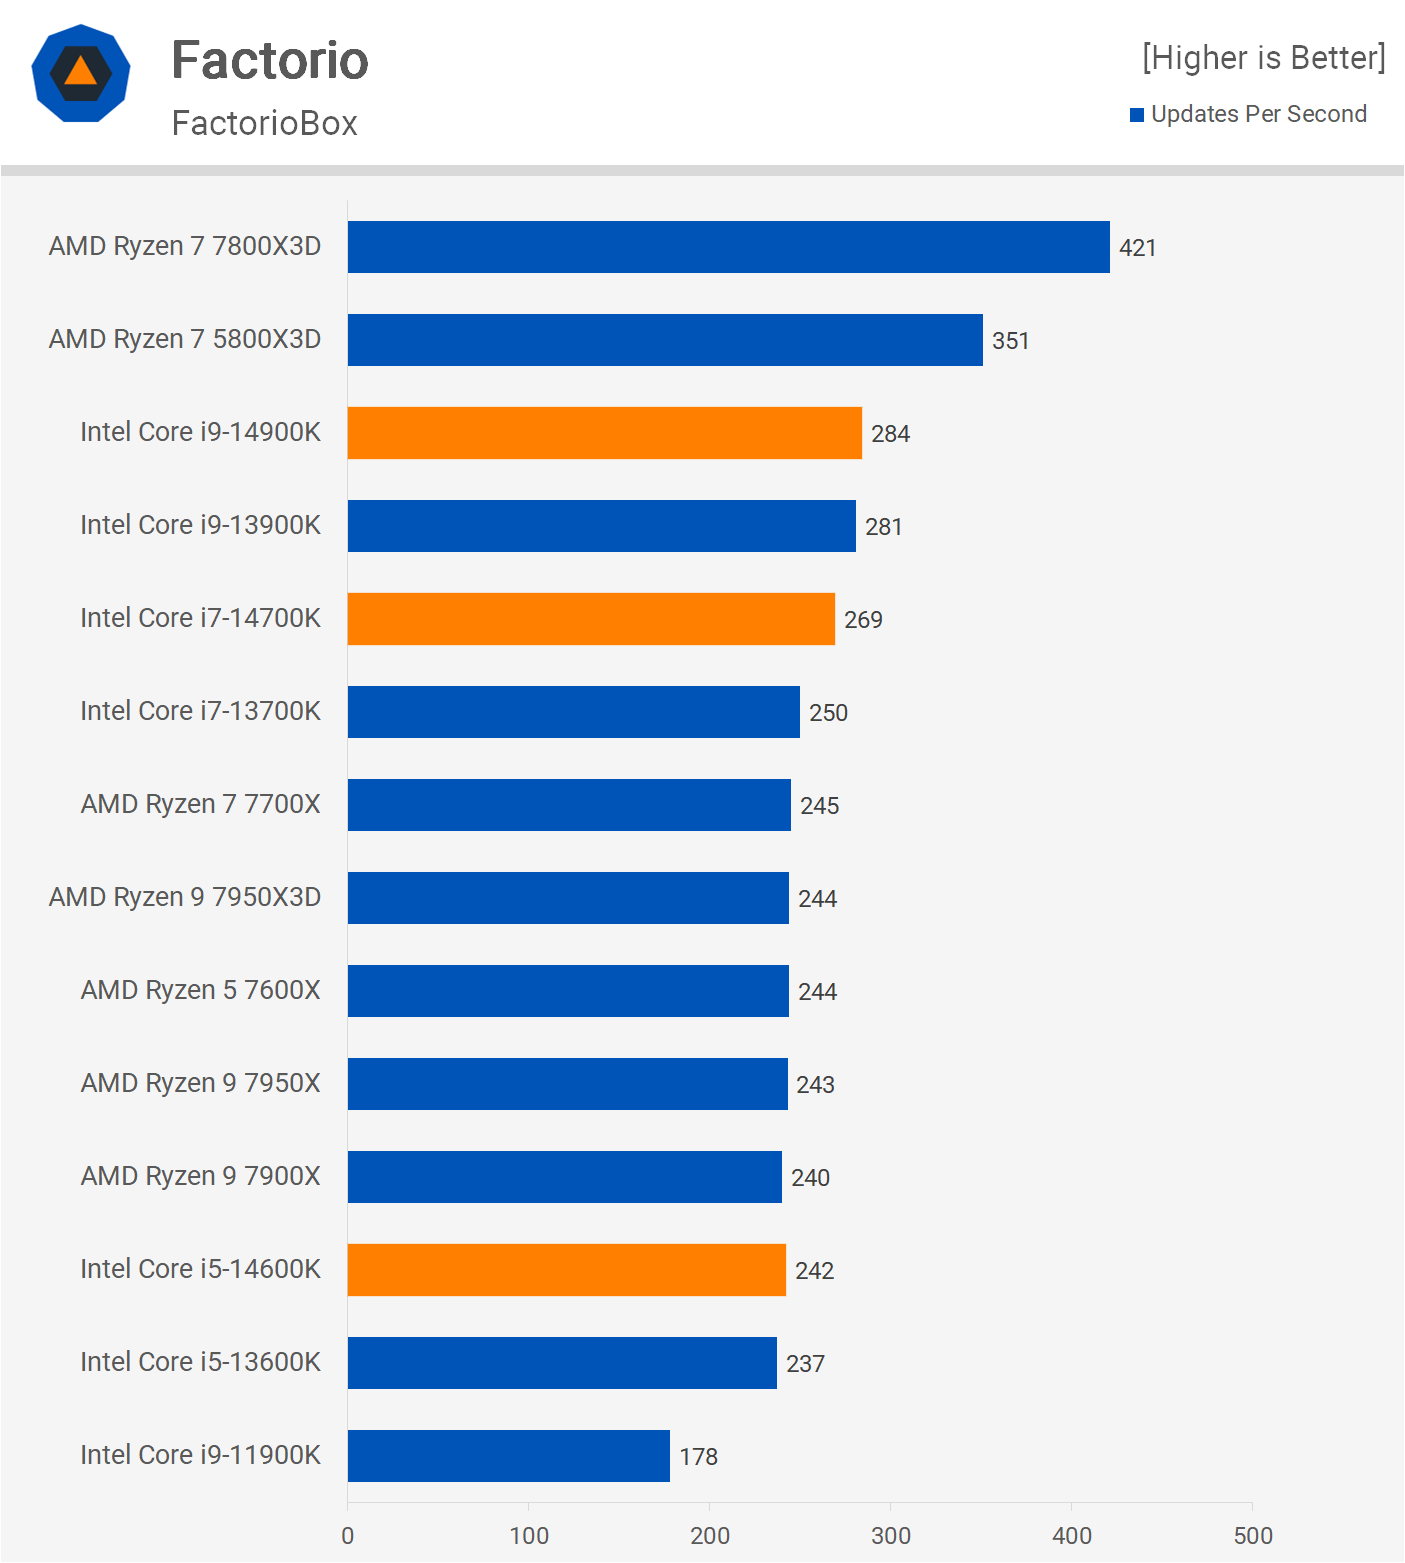
Starting with the gaming benchmarks, we begin with Factorio. The FactorioBox is a commonly used Factorio benchmark and the version we’ve previously utilized. However, we’ve been informed that this might not be the most representative test, as it’s based on a small map and might not accurately reflect performance, especially for larger maps. Because of its size, it fits well within the 3D V-Cache for CPUs like the 7800X3D, 7950X3D, and 5800X3D. Yet, dual CCD parts like the 7950X3D have some issues here. In our tests, the 7800X3D was nearly 50% faster than the 14900K. Due to potential inaccuracies with this test, we decided to re-evaluate using a larger map.
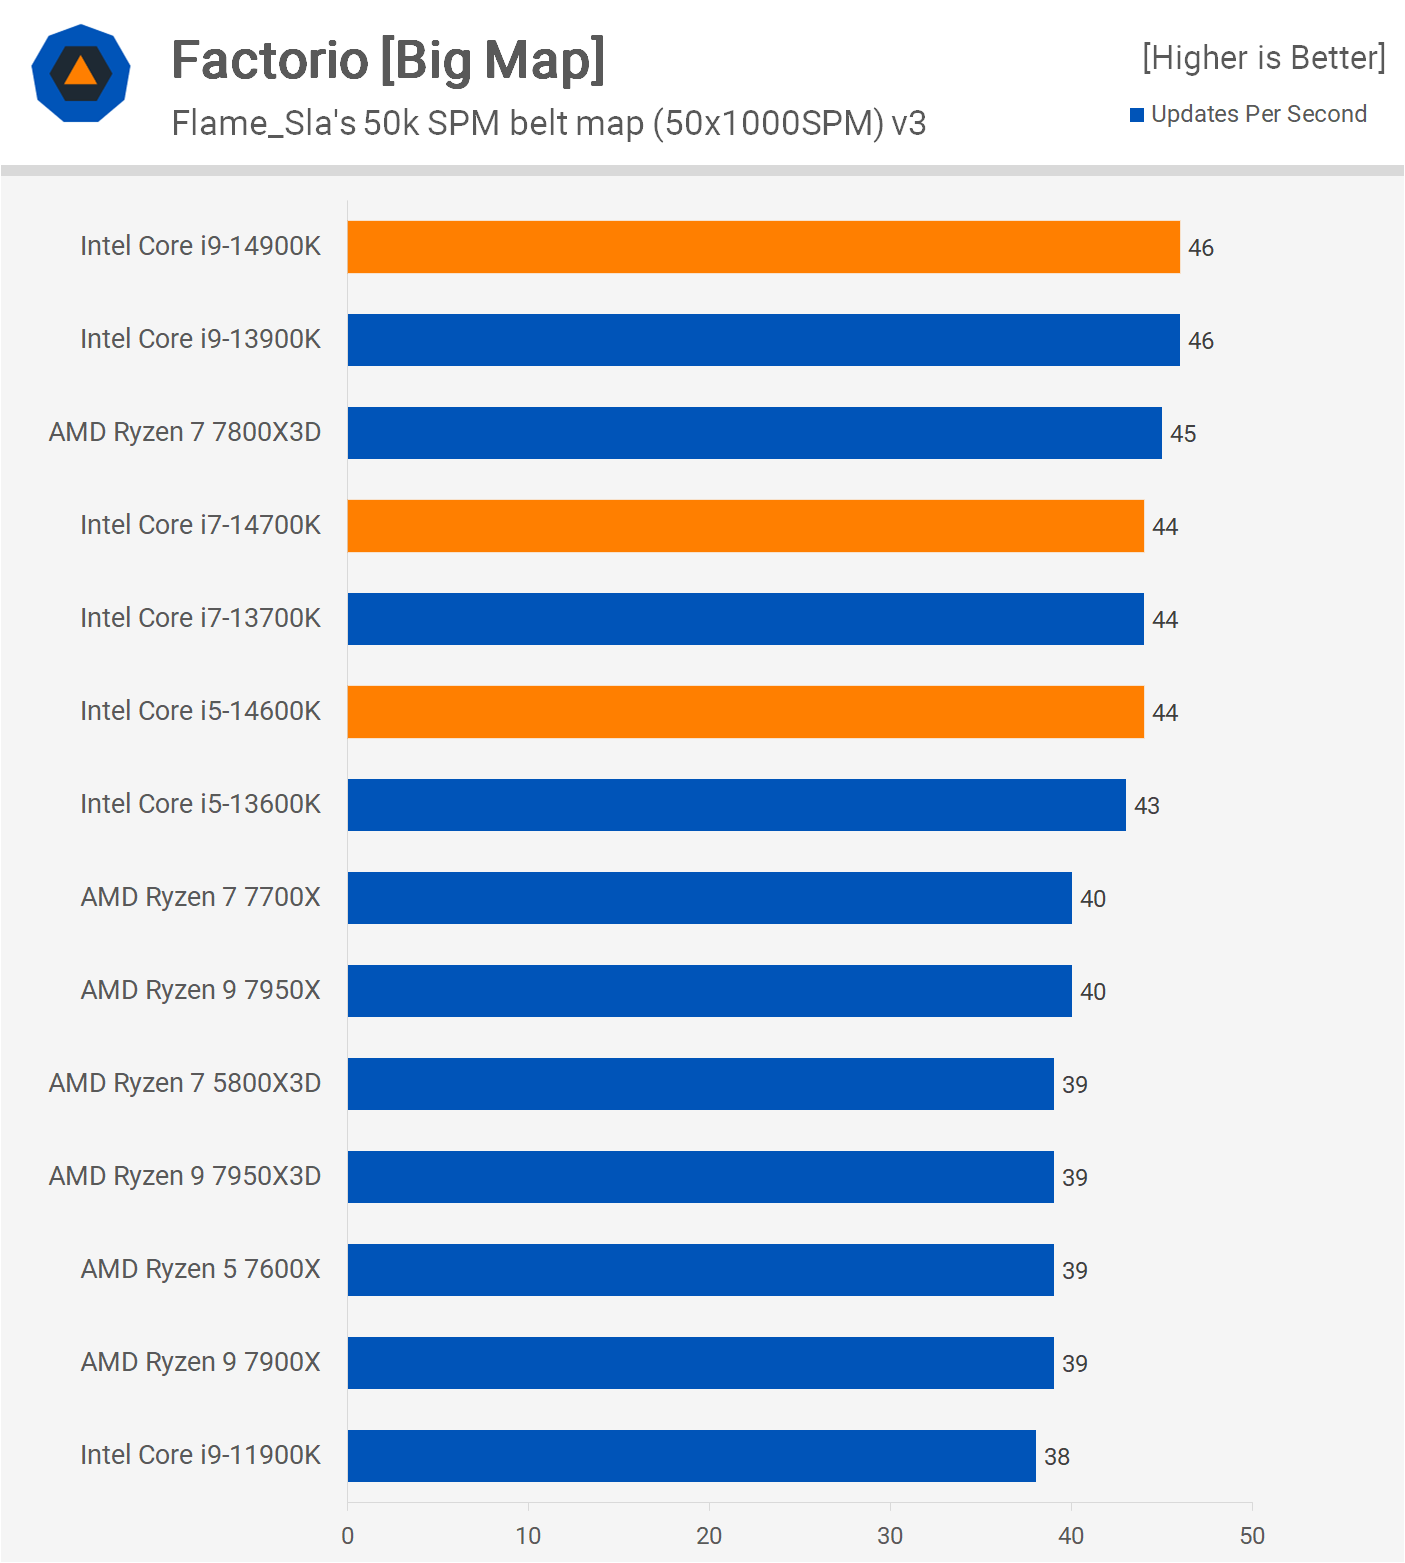
Testing on the larger map significantly altered our findings. Now, the 14900K and 13900K top the charts, narrowly outperforming the 7800X3D by a margin of 2%. Comparing the 13th and 14th gen models, we observed virtually identical performance.
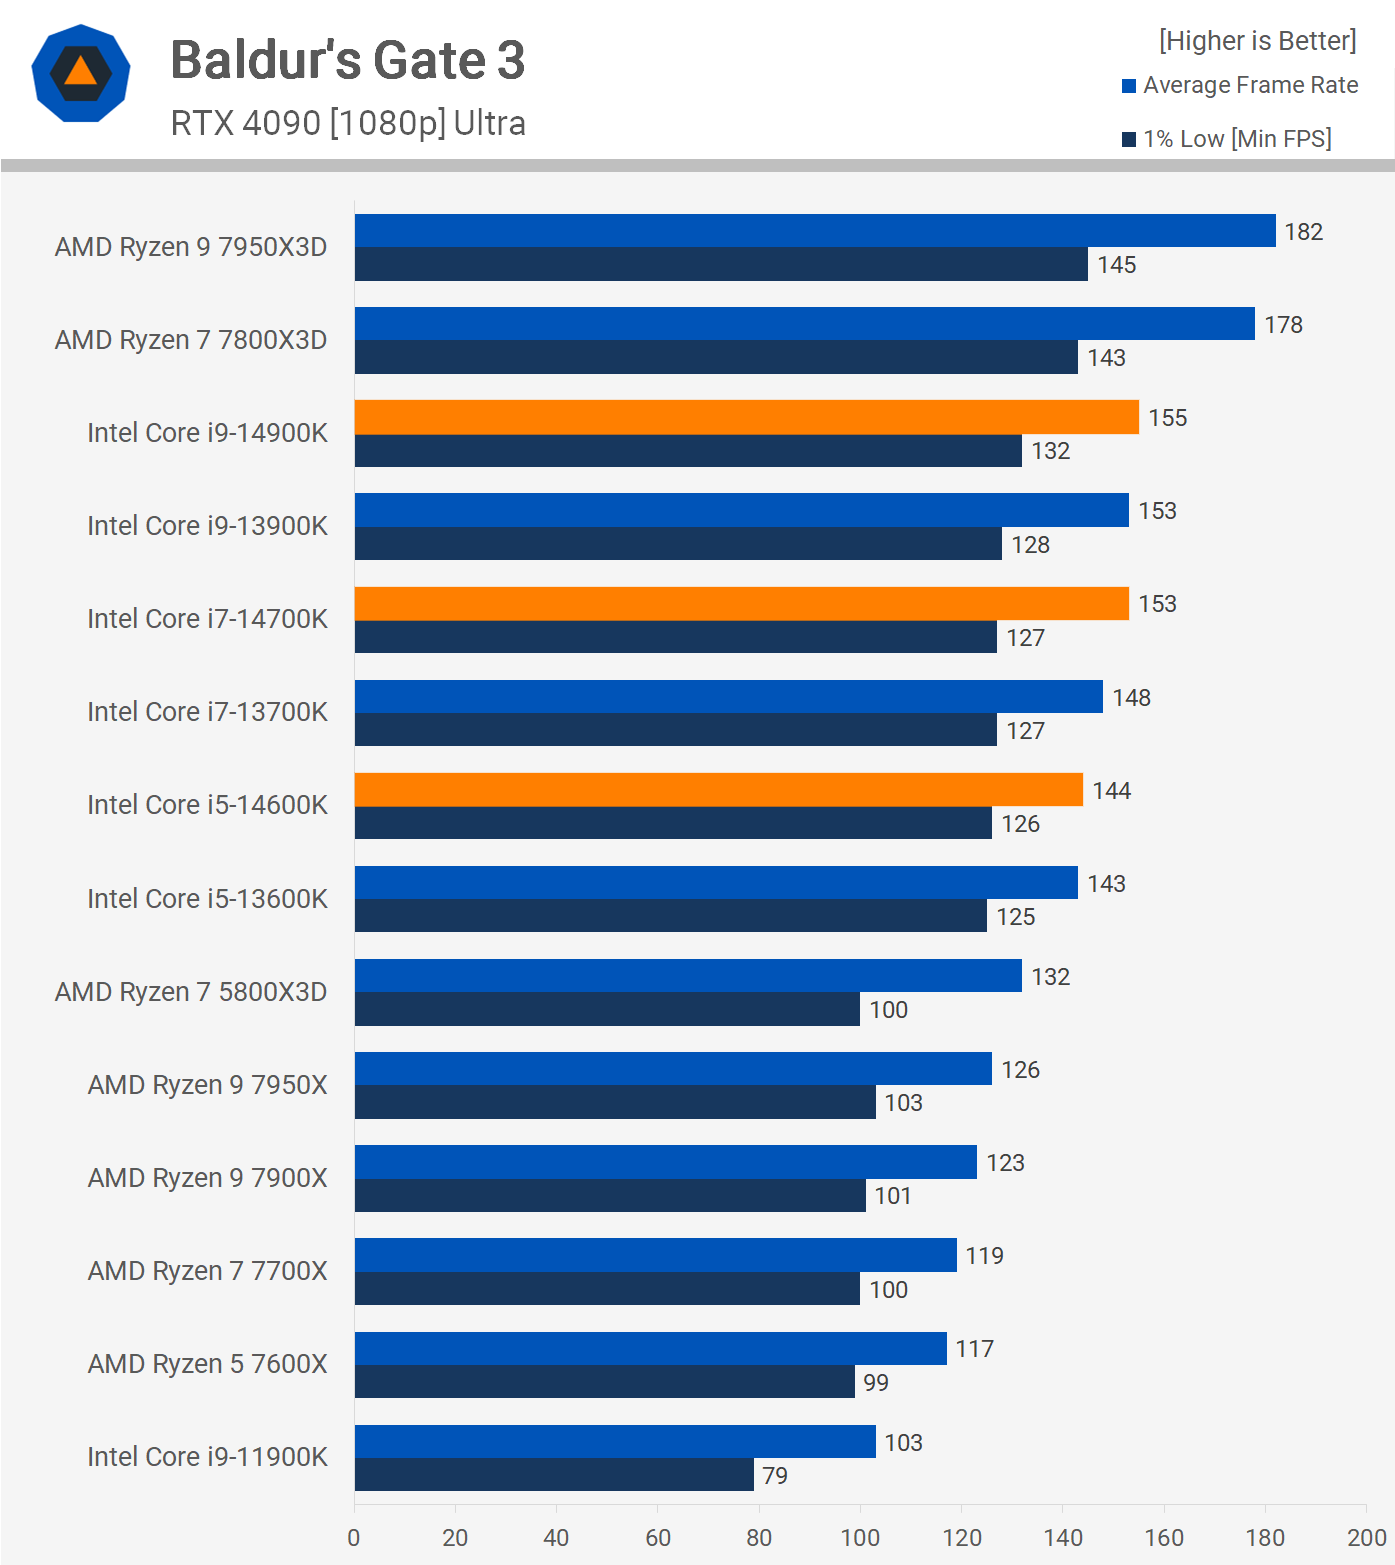
Transitioning to fps metrics, we begin with Baldur’s Gate 3, benchmarked in the CPU-intensive city of Baldur’s Gate. The 14th gen models showed minimal improvements over the 13th gen models, a maximum of 3% in our tests.
This poses challenges for Intel since the Zen 4 3D V-Cache models are over 15% faster, with the 7950X3D being 17% faster than the 14900K.
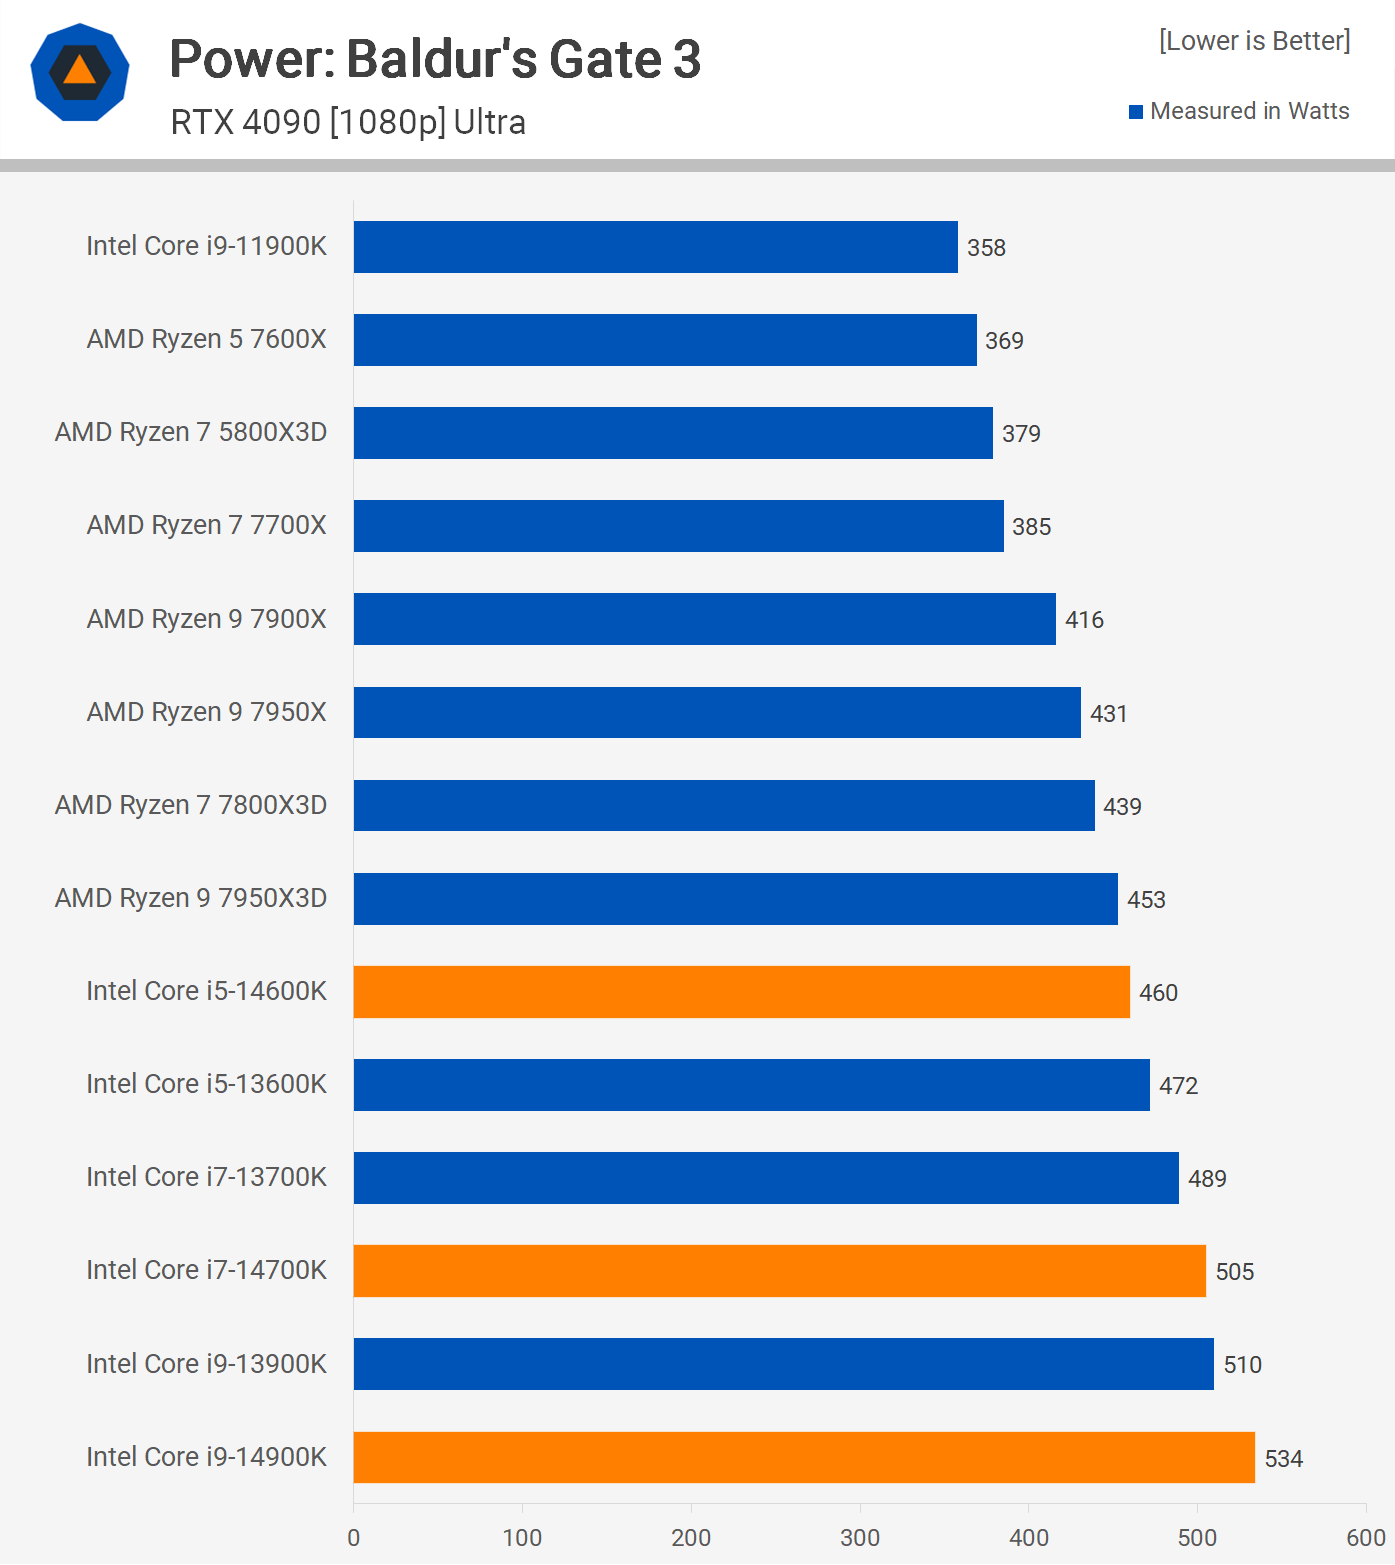
During these tests, we monitored average total system power consumption. Notably, despite its 17% speed advantage, the 7950X3D reduced power consumption by 15%, marking it as more efficient than the 14900K.
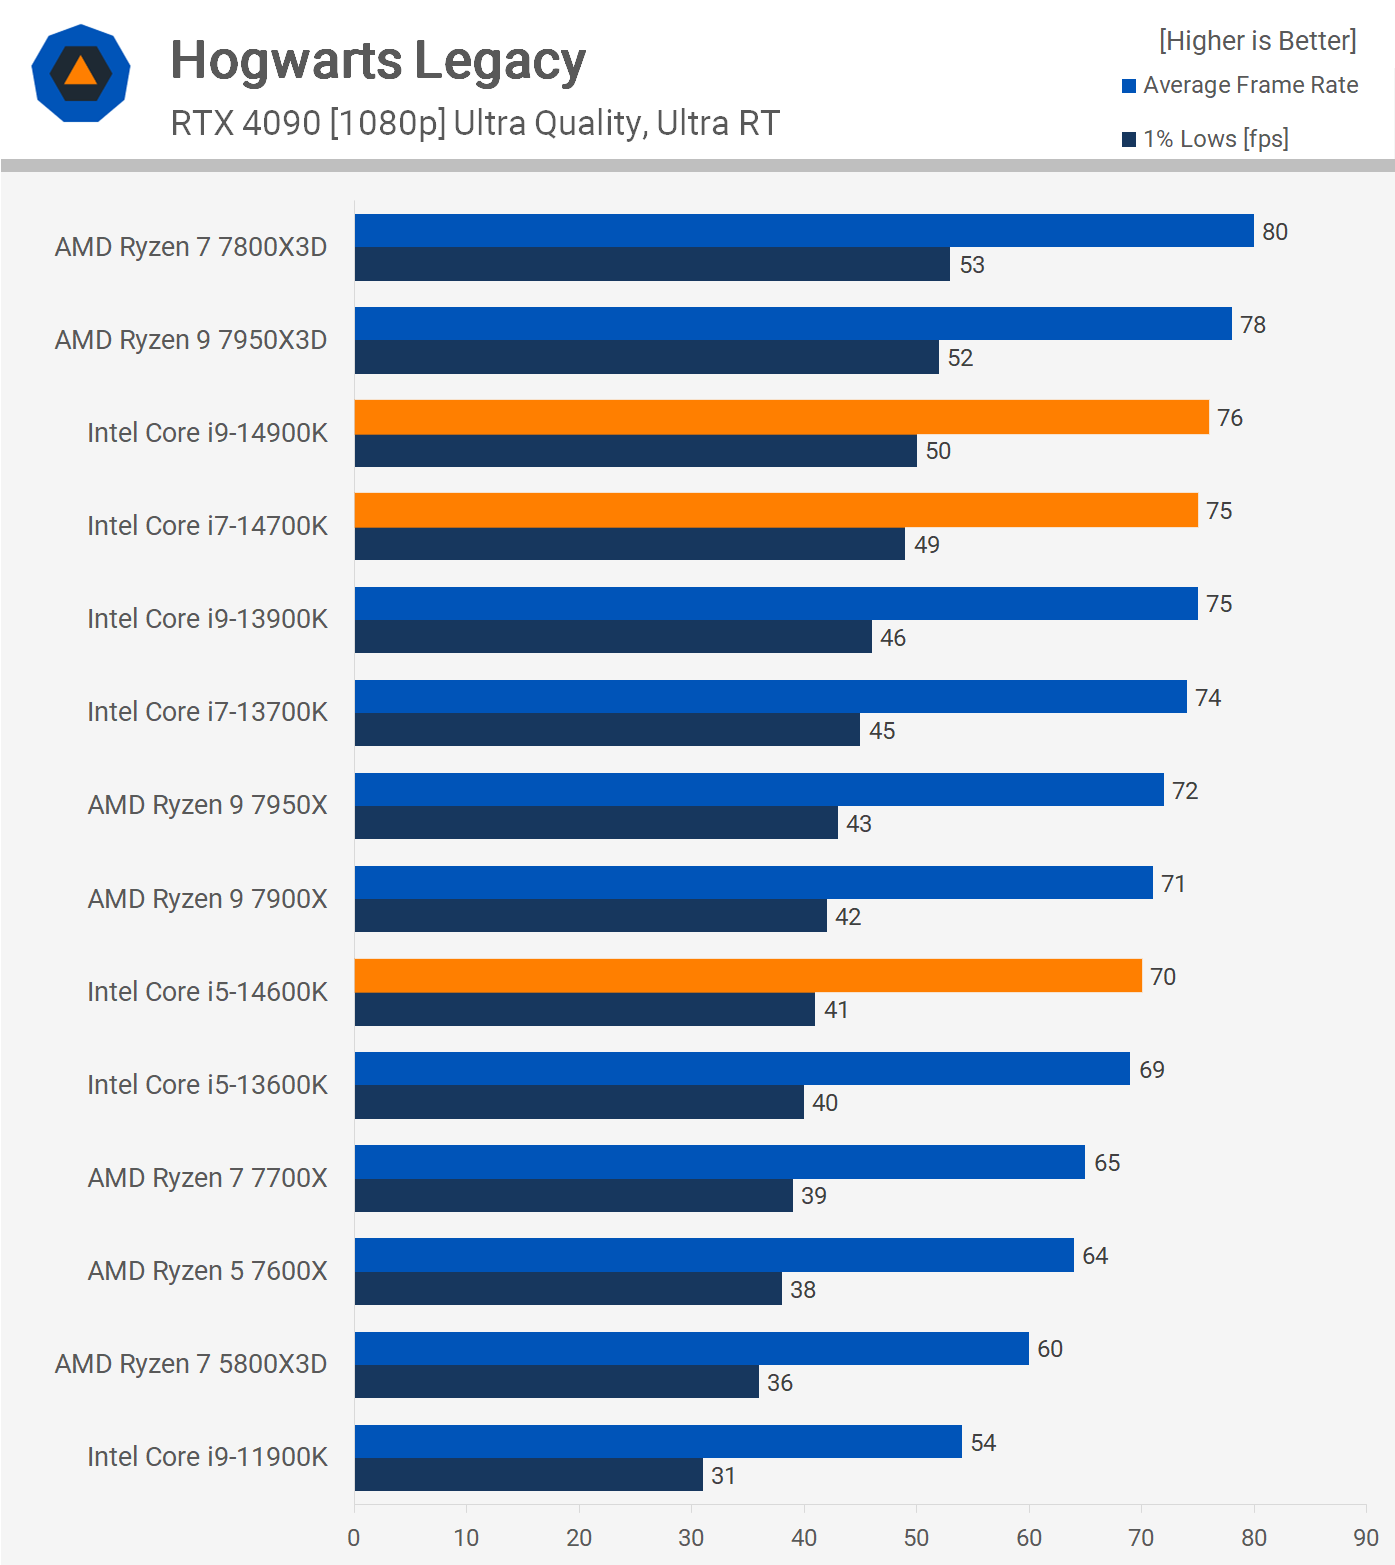
For Hogwarts Legacy, with ultra ray tracing enabled, the 7950X3D outpaced the 14900K by 4%, while the 7800X3D was 6% faster. Relative to the 13900K, the 14900K showed a 5% performance increase, a similar trend observed between the 14700K and 14600K and their predecessors.
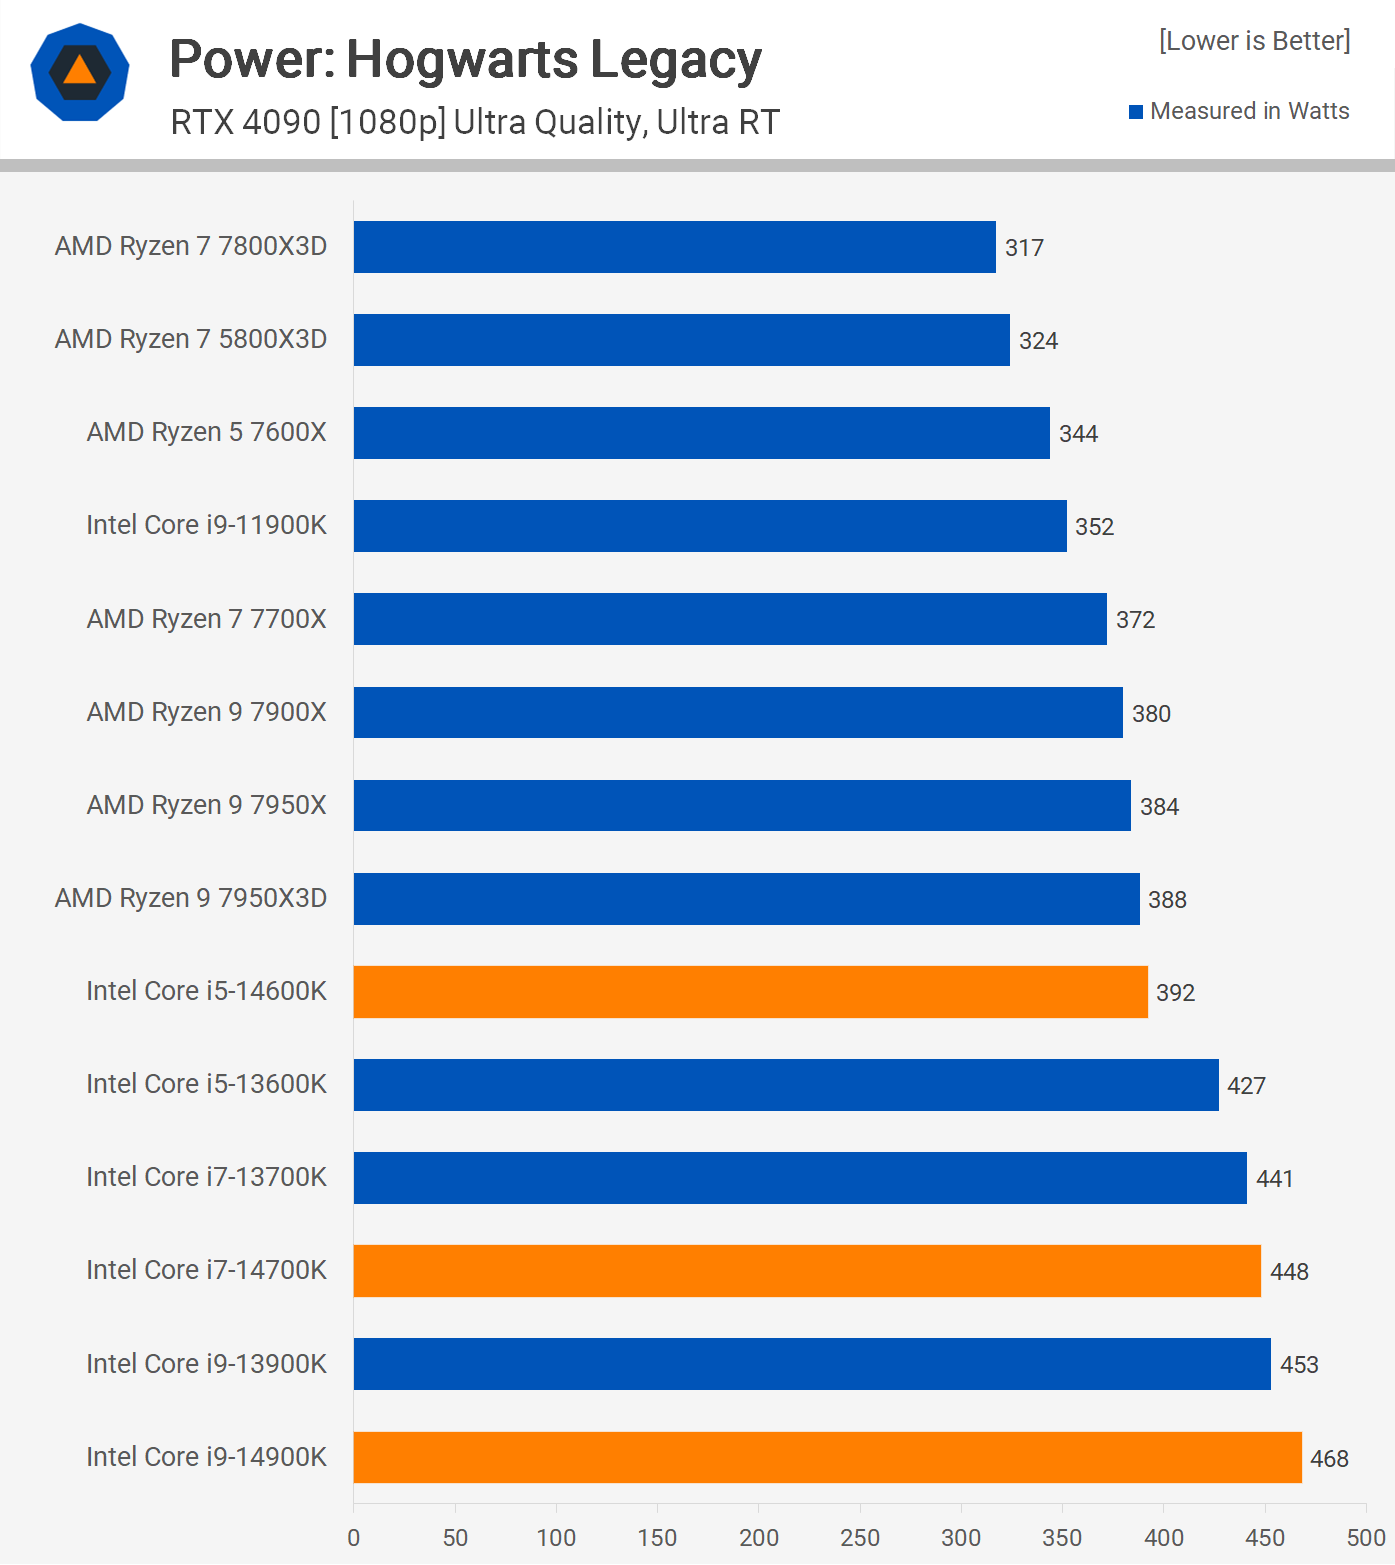
Power consumption remains a concern for Intel. Even though it’s marginally slower than the 7950X3D, the 14900K increased total system power consumption by a substantial 21%.
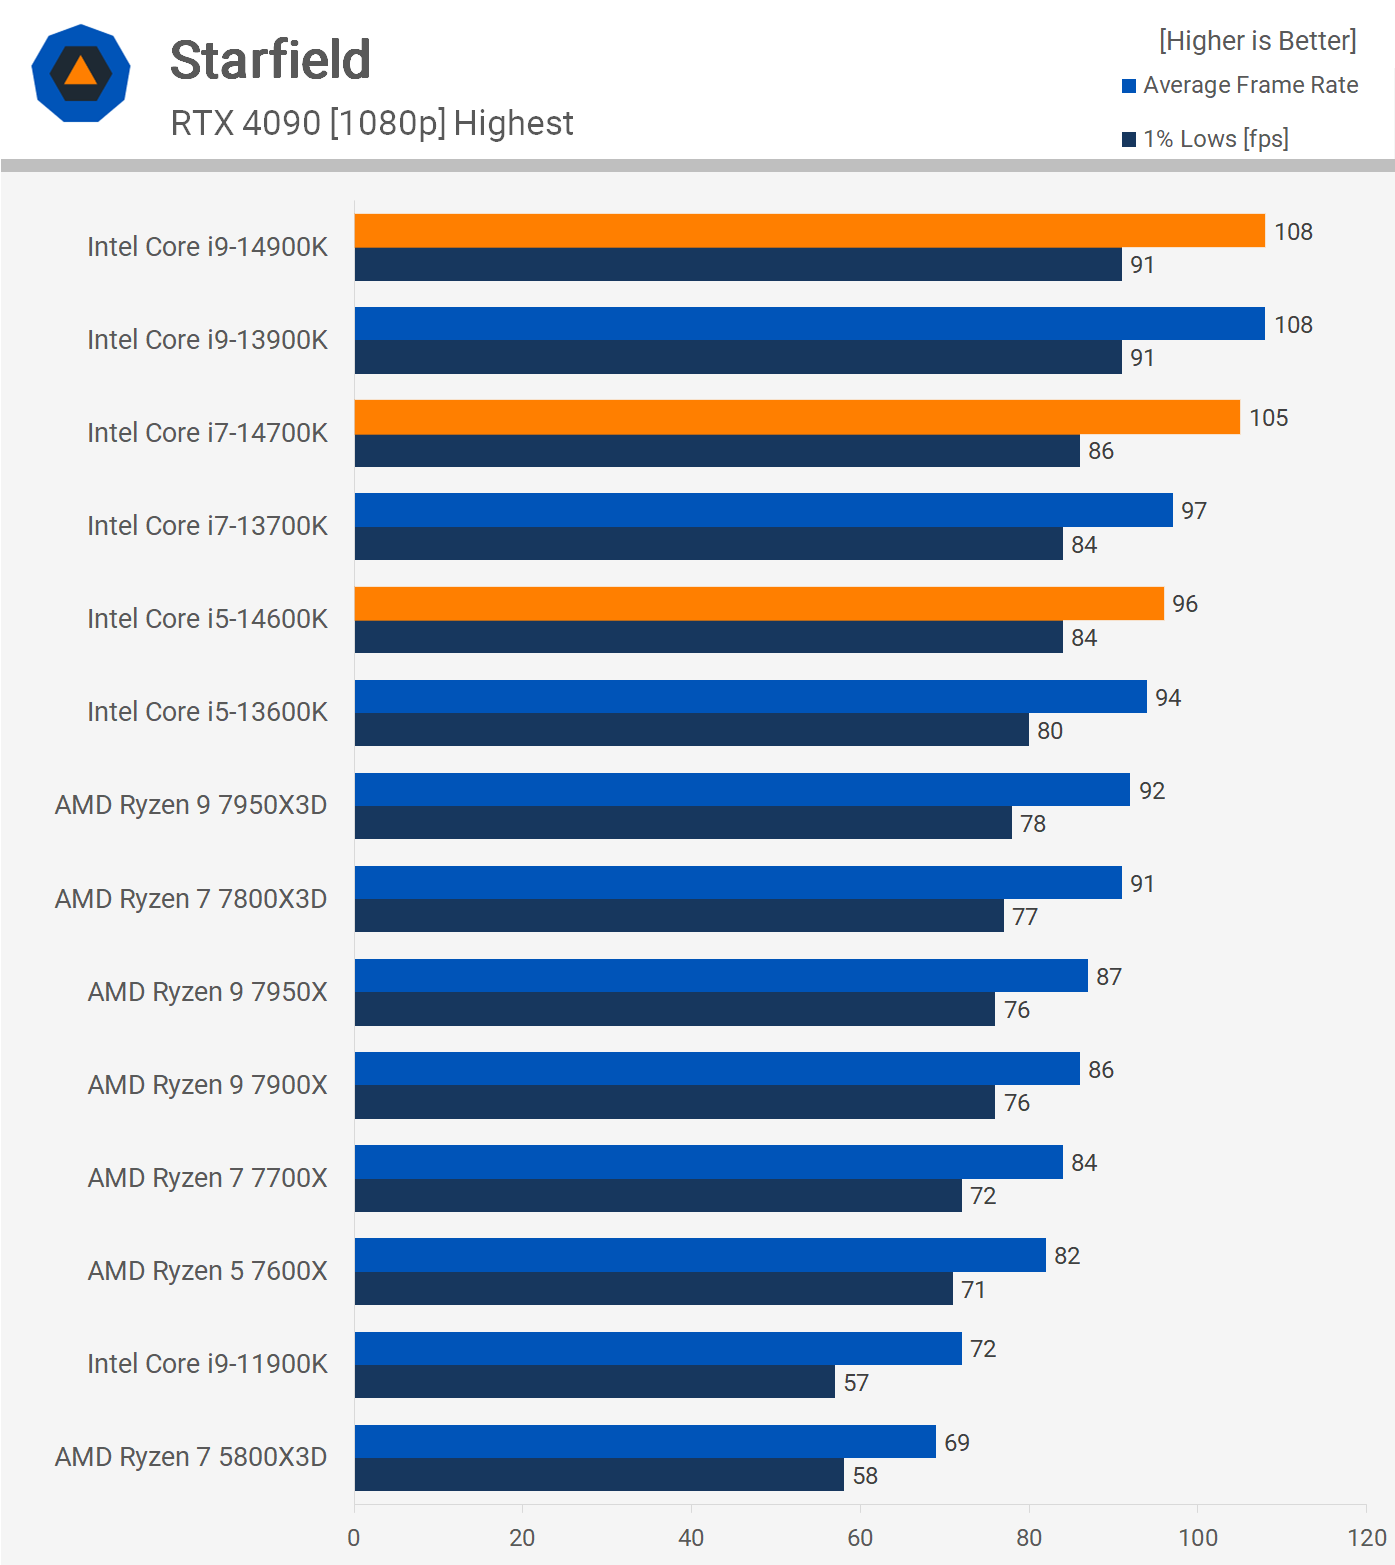
Although Starfield is an AMD-sponsored title, it performed impressively on Intel processors. In our tests, the 14900K was a remarkable 17% faster than the 7950X3D, even though it showed no performance gains over the 13900K. Interestingly, the 14700K outperformed the 13700K by 8%, but the 14600K showed no tangible improvements over the 13600K.
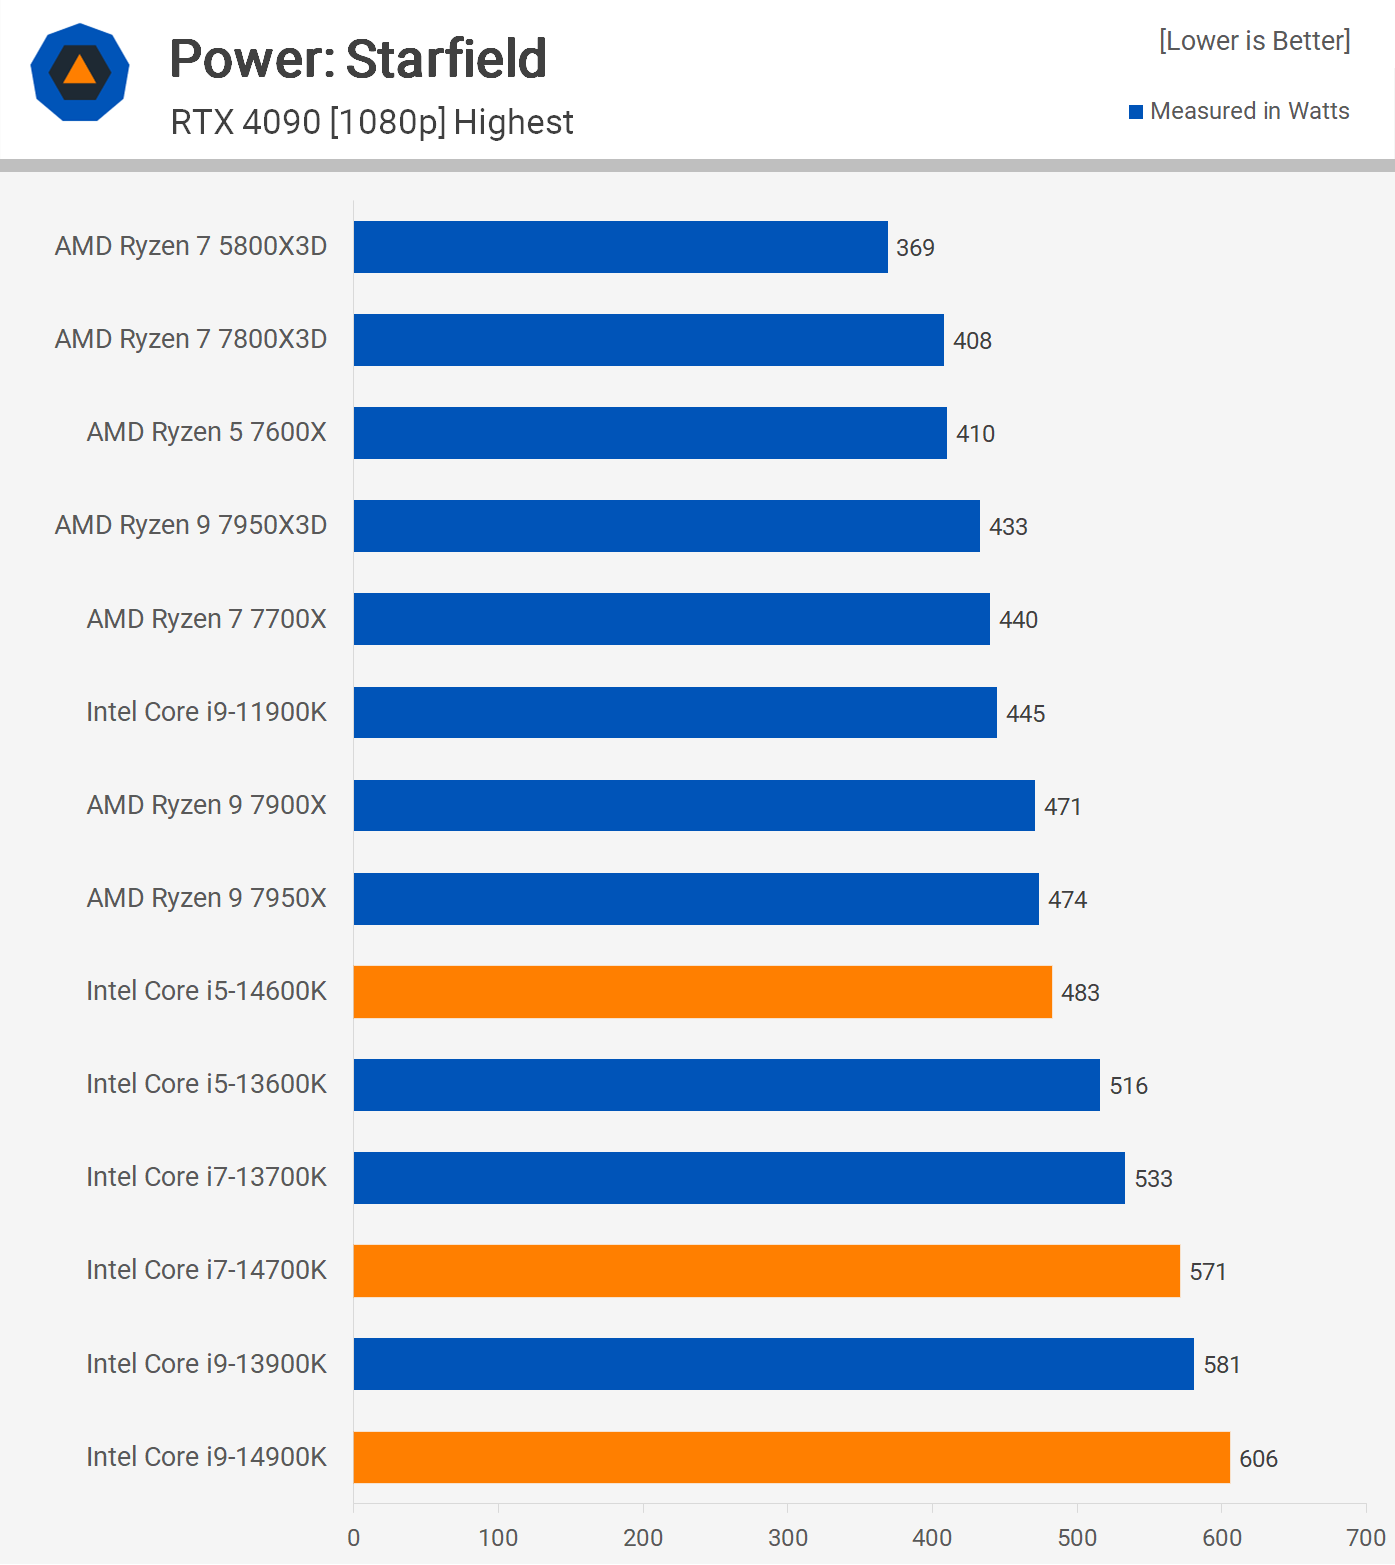
From a power perspective, even though the 14900K was 17% faster than the 7950X3D, it drove total system usage up by 40%, highlighting that the 3D V-Cache model remains more efficient.
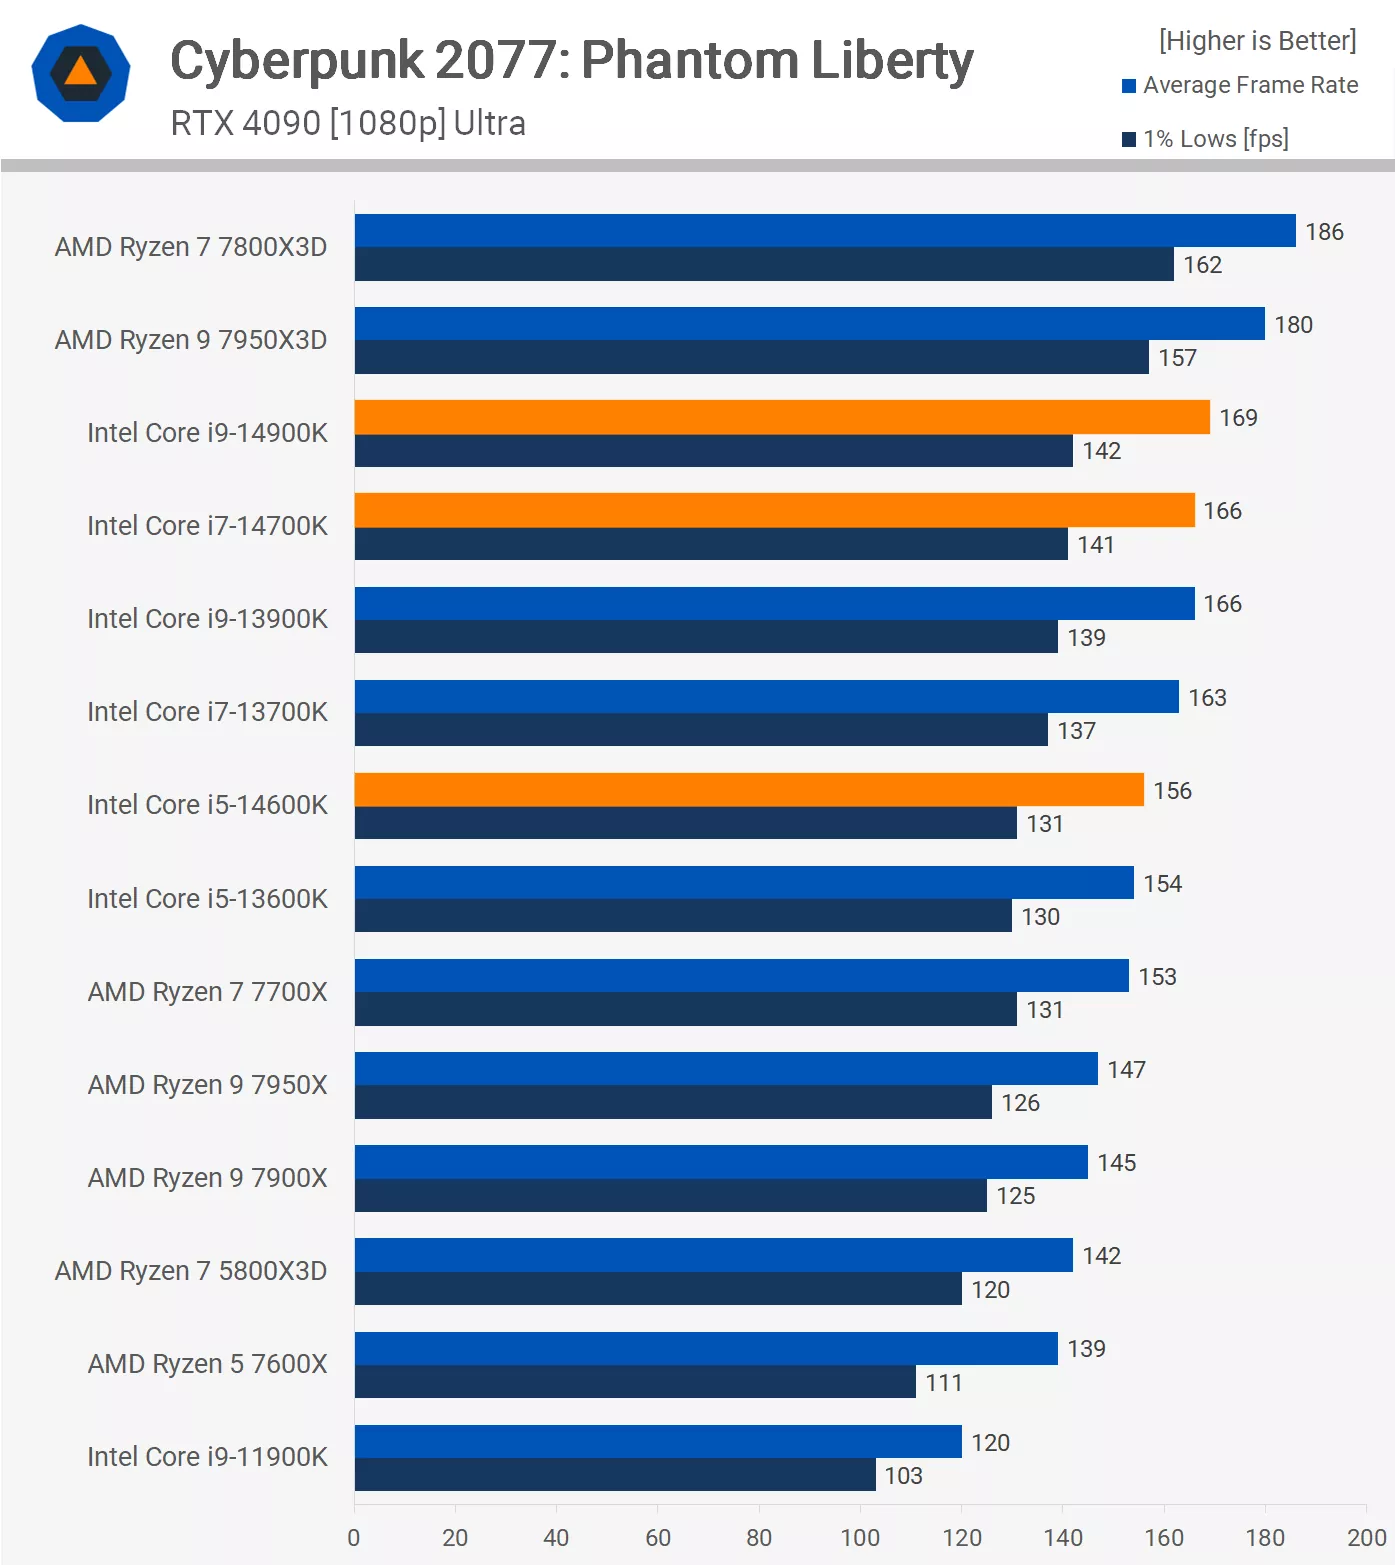
With Cyberpunk 2077: Phantom Liberty, the 3D V-Cache processors consistently shone. The 7800X3D surpassed the 14900K by 10%, and the 7950X3D by 7%. Unfortunately, when compared with their 13th gen counterparts, the 14900K and 14700K yielded just a 2% improvement, with the 14600K improving by a mere 1%.
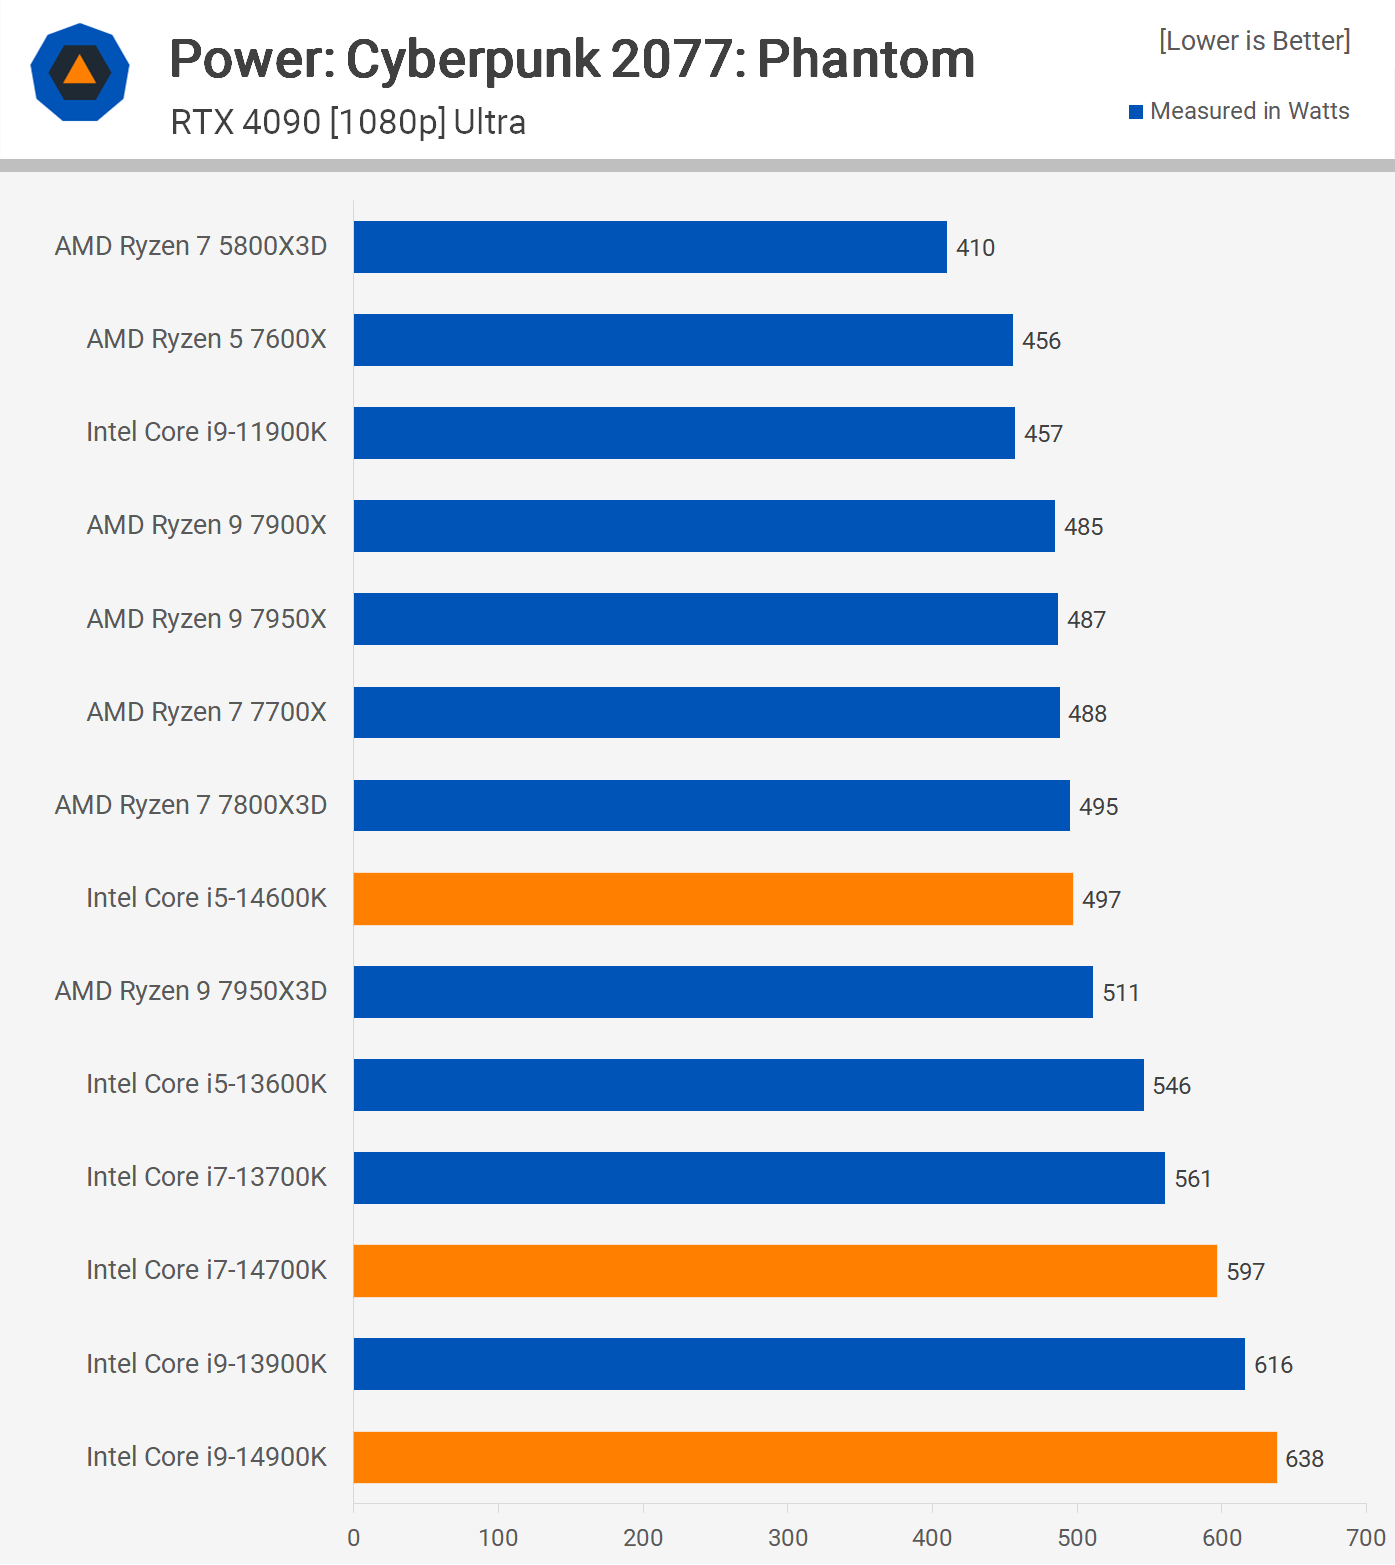
In terms of power, the 14600K matched the 7800X3D’s total system usage, despite the AMD processor being nearly 20% faster. One significant issue with the Core i9 series became evident: the 14900K increased total system usage almost 30% over the 7800X3D, delivering inferior performance.
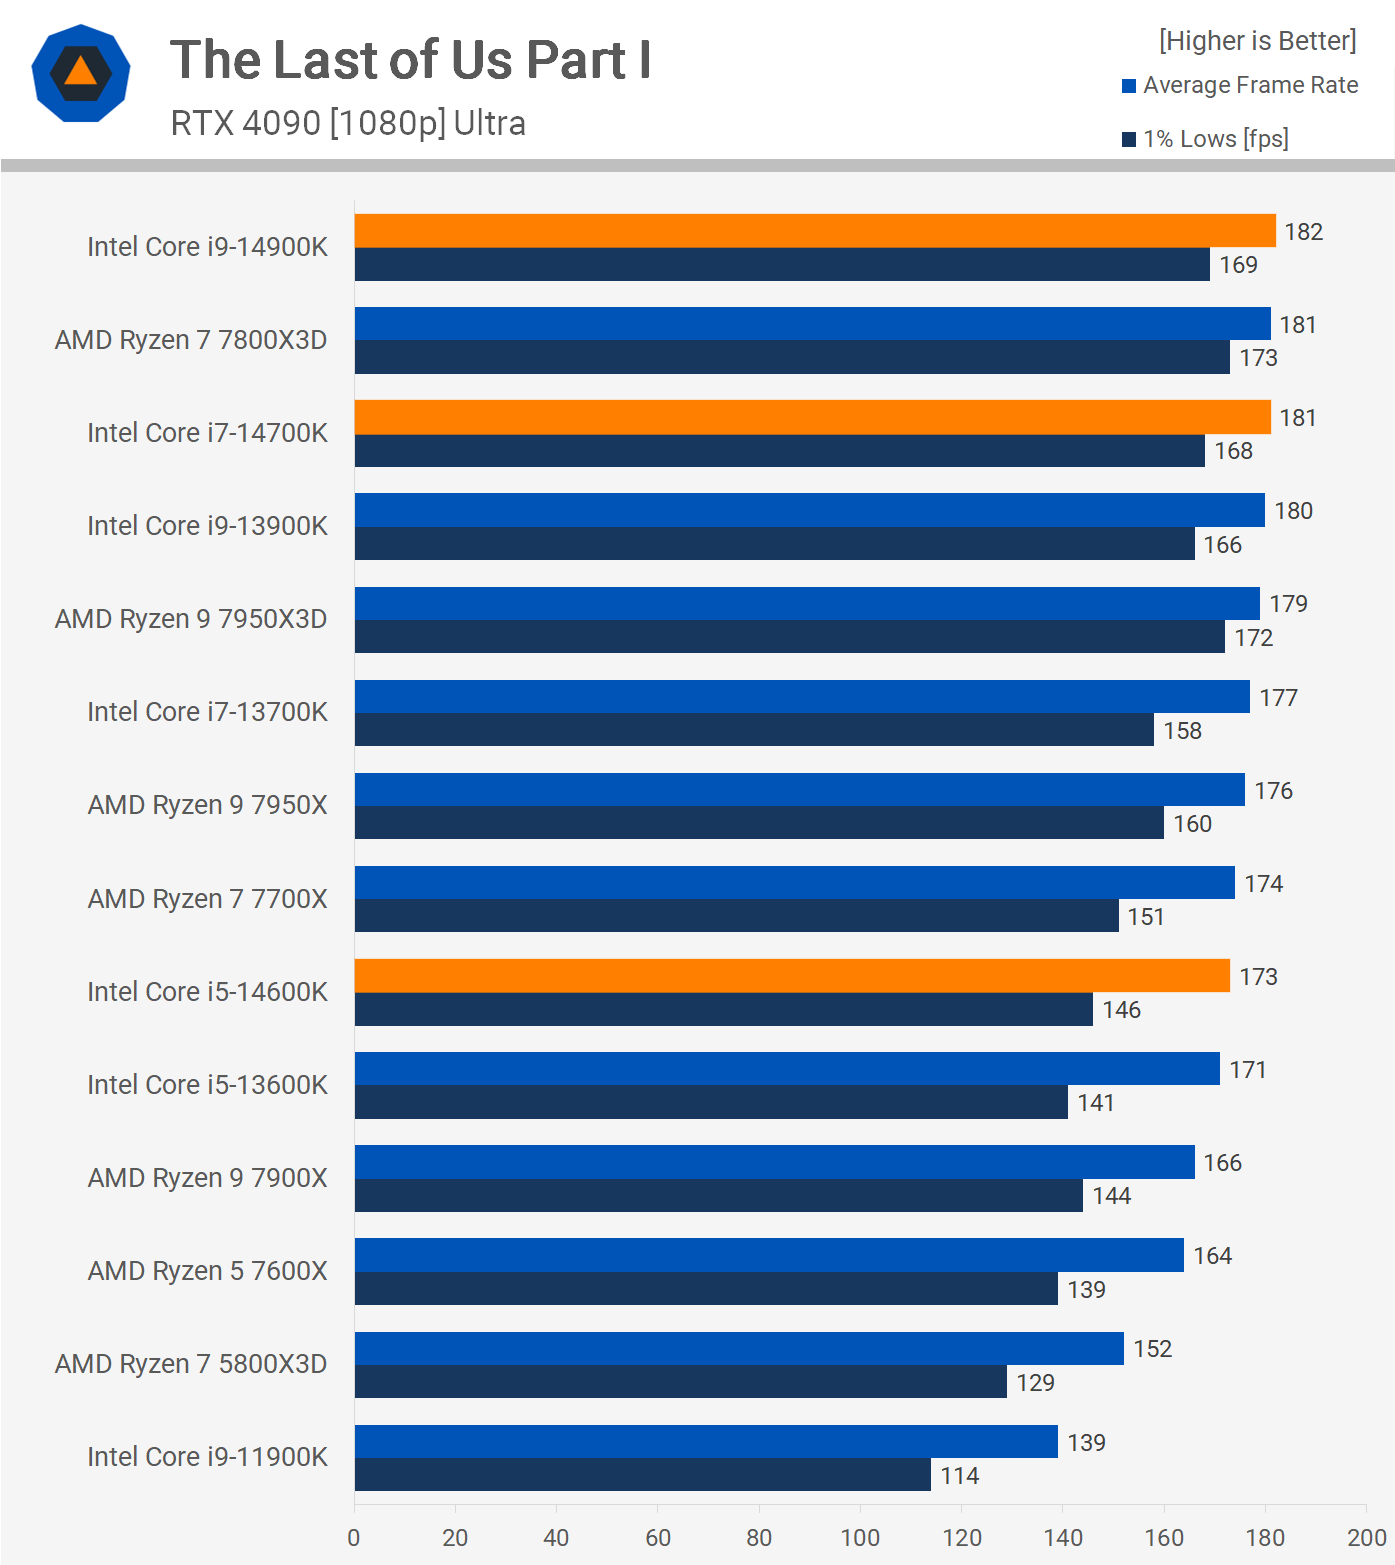
Performance in The Last of Us Part I displayed a tight competition between the AMD and Intel processors. However, we observed no significant change in performance from the 13th gen to 14th gen processors beyond the slight frequency increase.
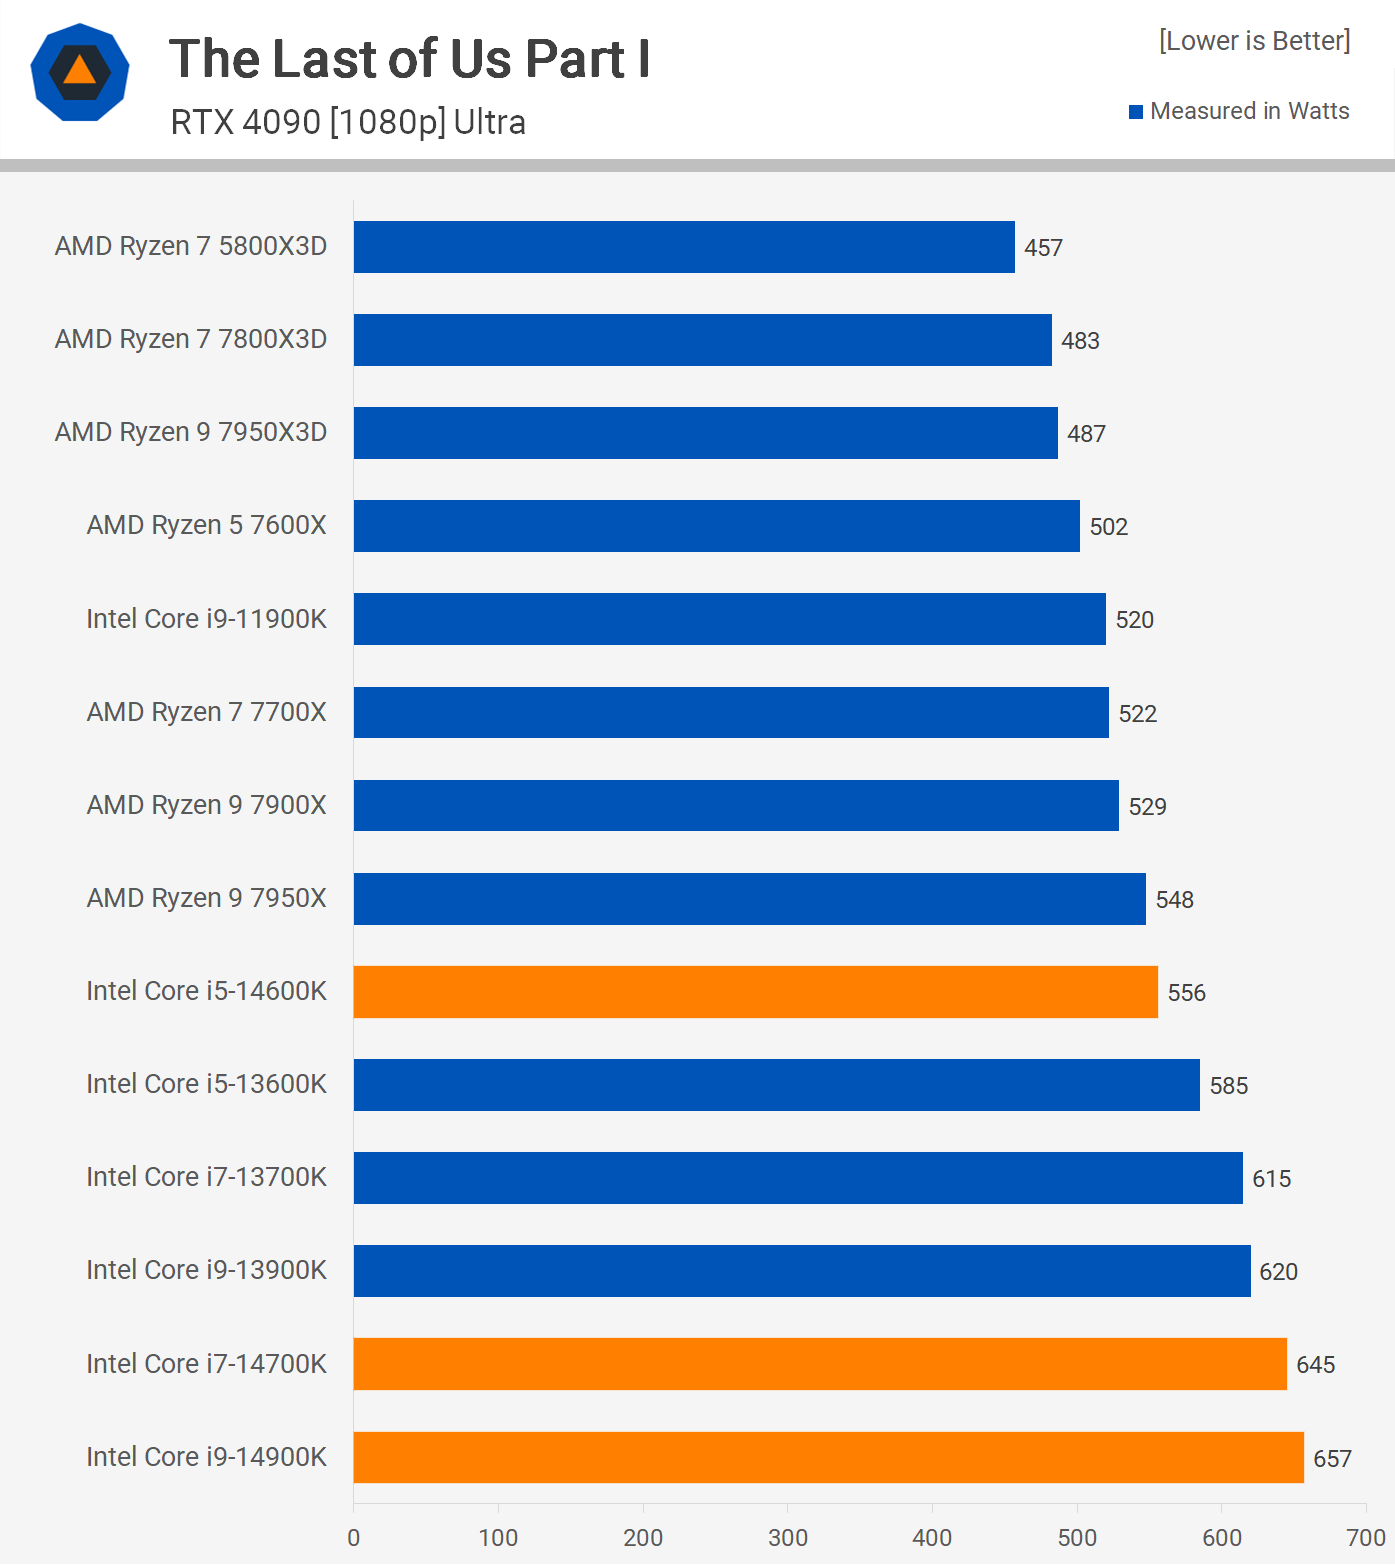
The efficiency of AMD’s Zen 4 3D V-Cache processors in The Last of Us stands out. They align with the performance of the Core i7 and i9 processors but are far more power-conservative. For instance, the 14900K elevated total system usage to 657 watts, marking nearly a 40% jump compared to the similarly performing 7800X3D.
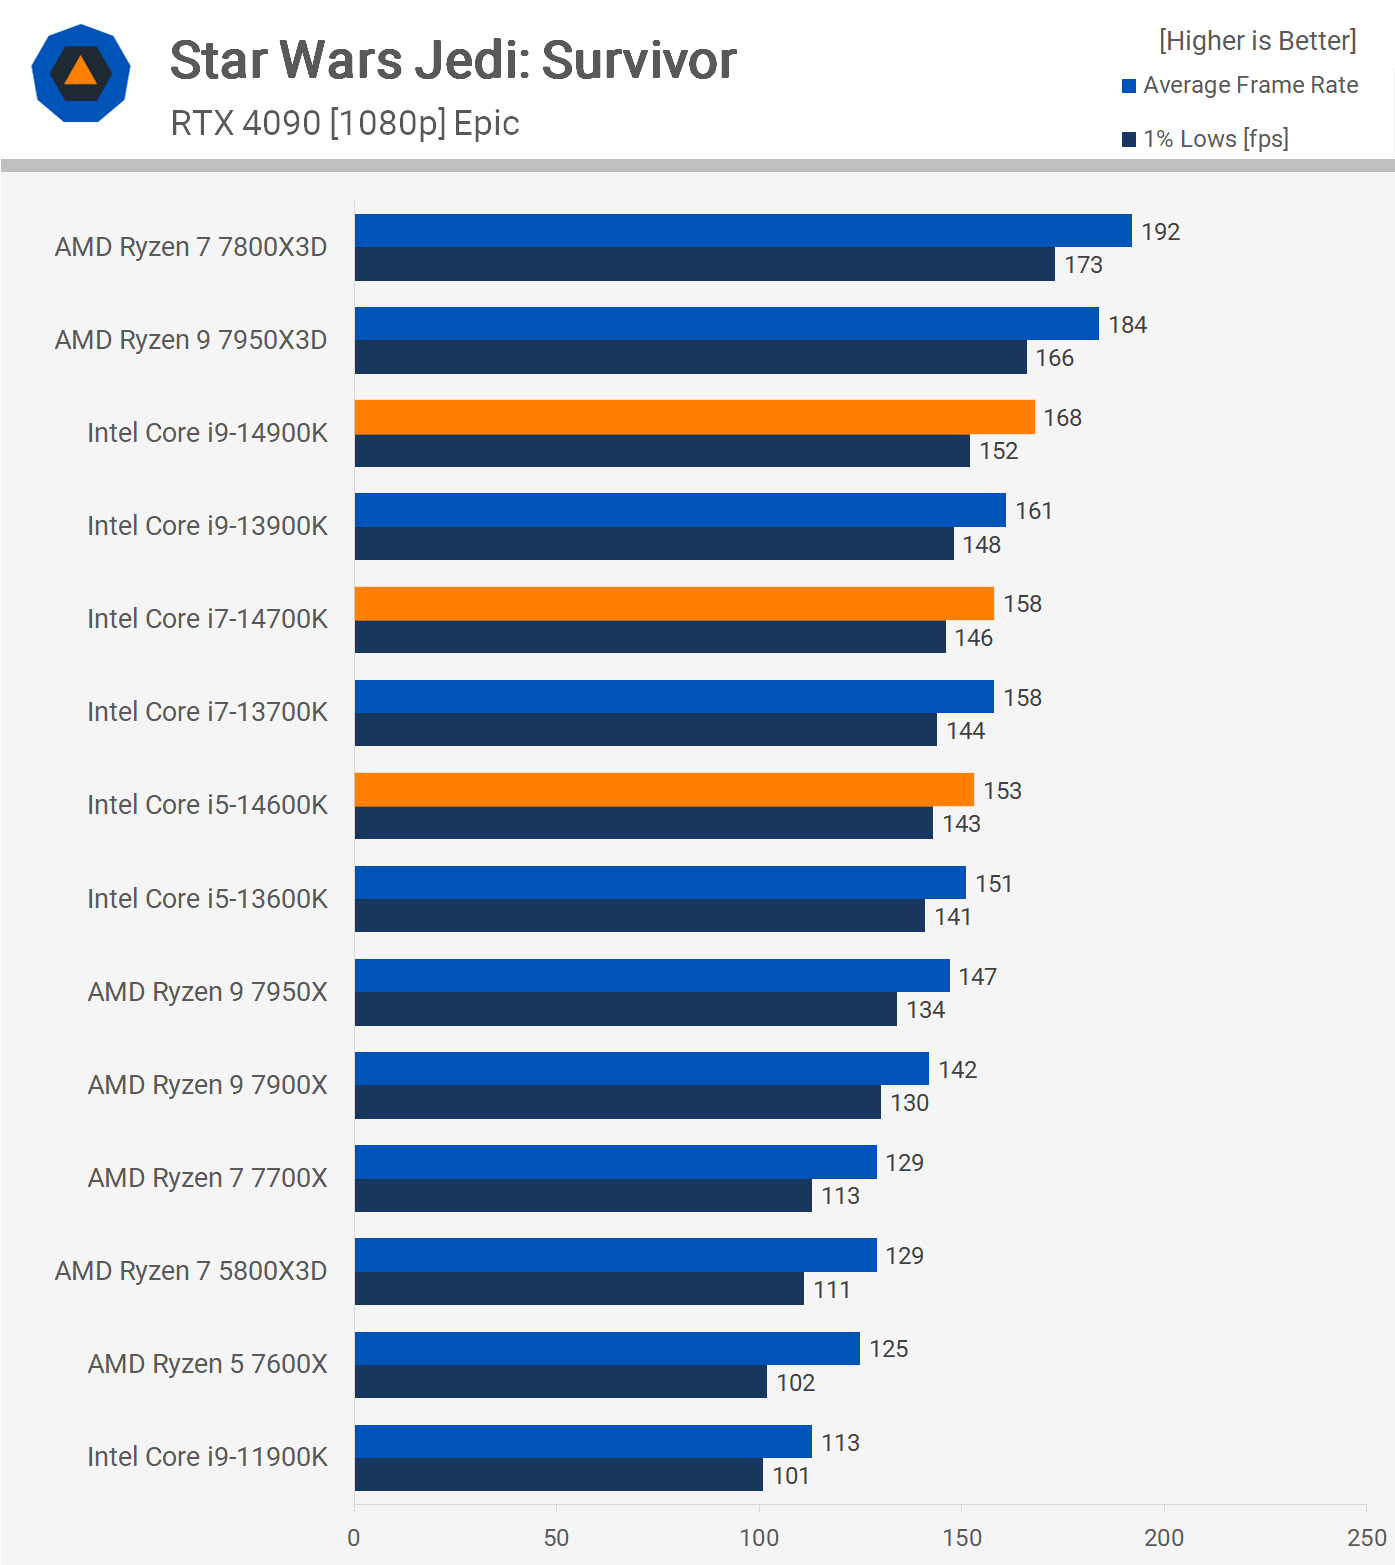
The performance of the 3D V-Cache processors in Star Wars Jedi: Survivor is notable. The 7800X3D outperformed the 14900K by 14%. On the other hand, the 14900K showed only a 4% speed advantage over the 13900K. Additionally, the i7 and i5 variants didn’t surpass their previous iterations. In contrast to the non-3D V-Cache units, the Raptor Lake CPUs showcased significant prowess, with the 14600K outpacing the 7950X.
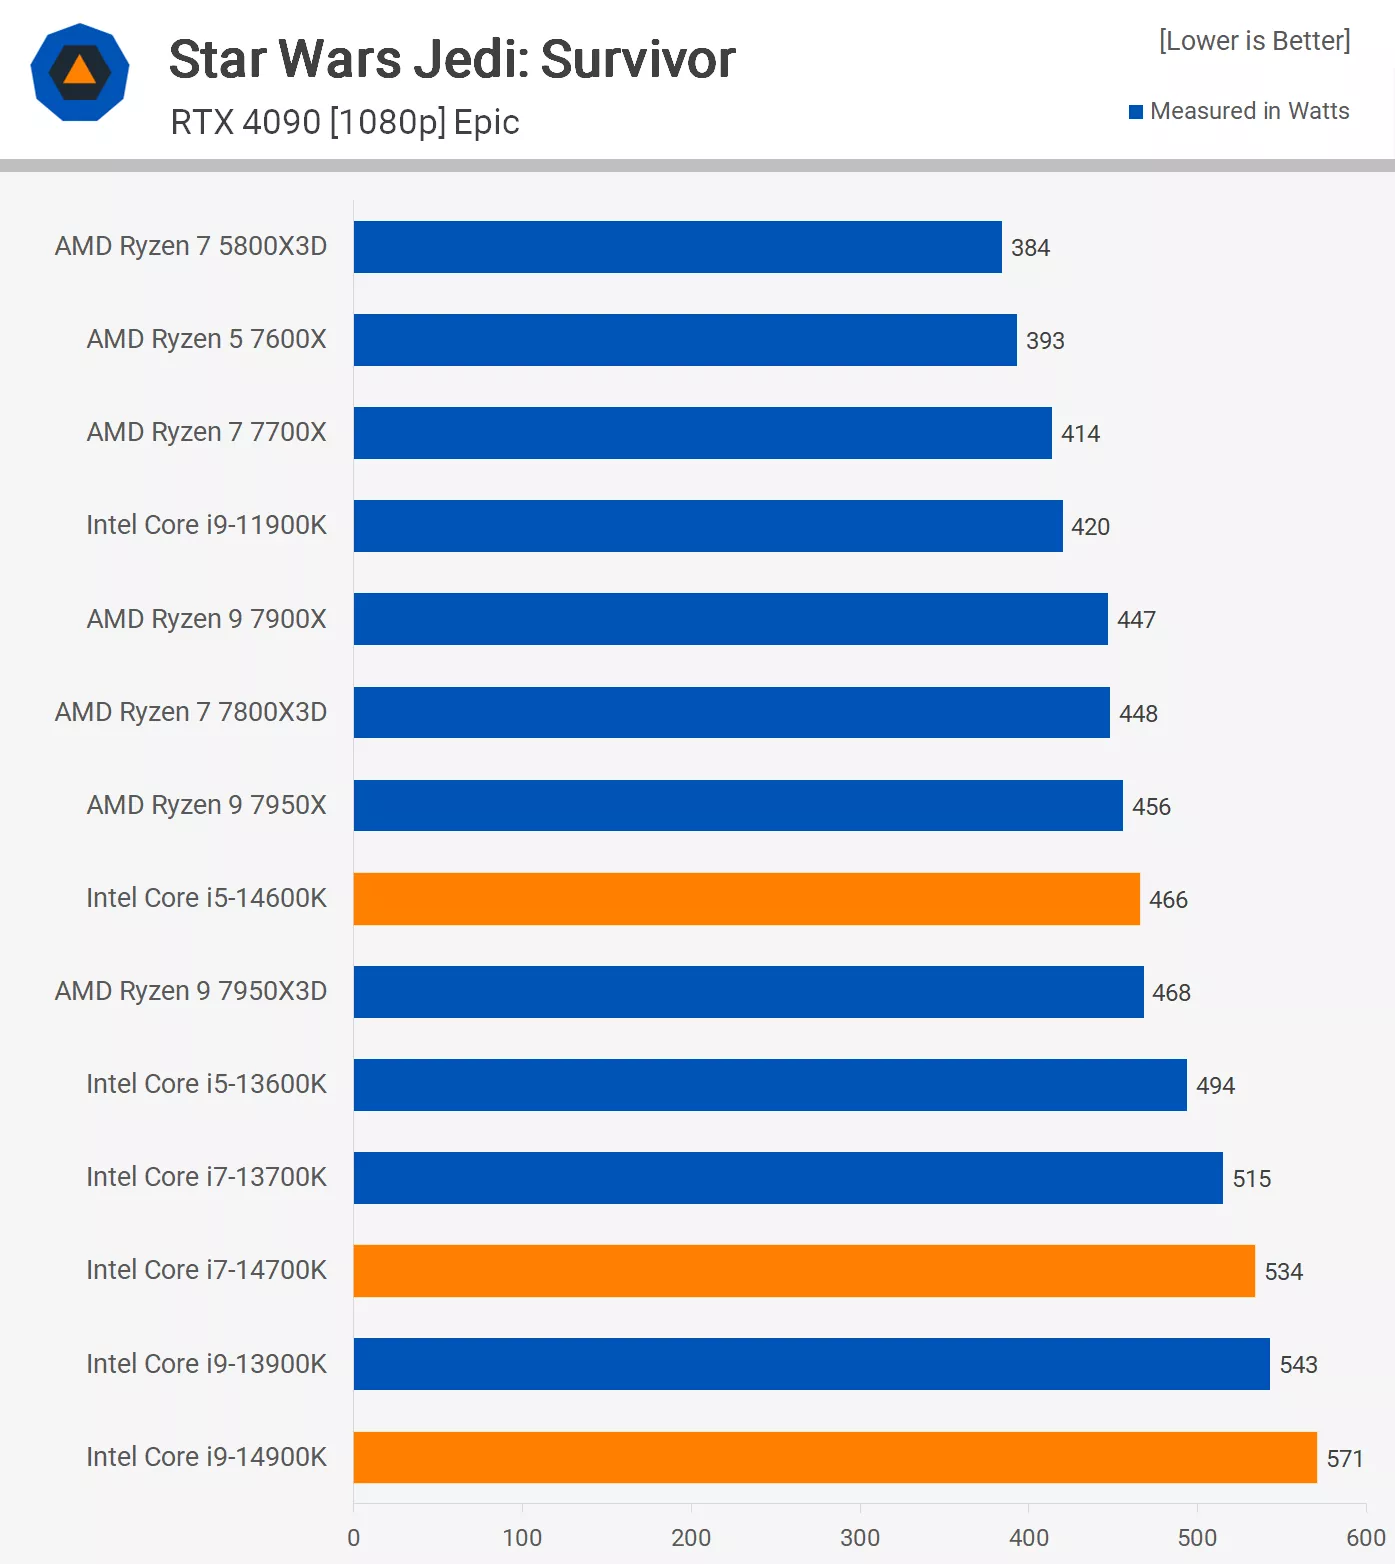
Power consumption continues to be Intel’s Achilles heel. The 14900K’s total system draw was 571 watts, a modest 5% more than the 13900K, but a substantial 27% hike over the 7800X3D.
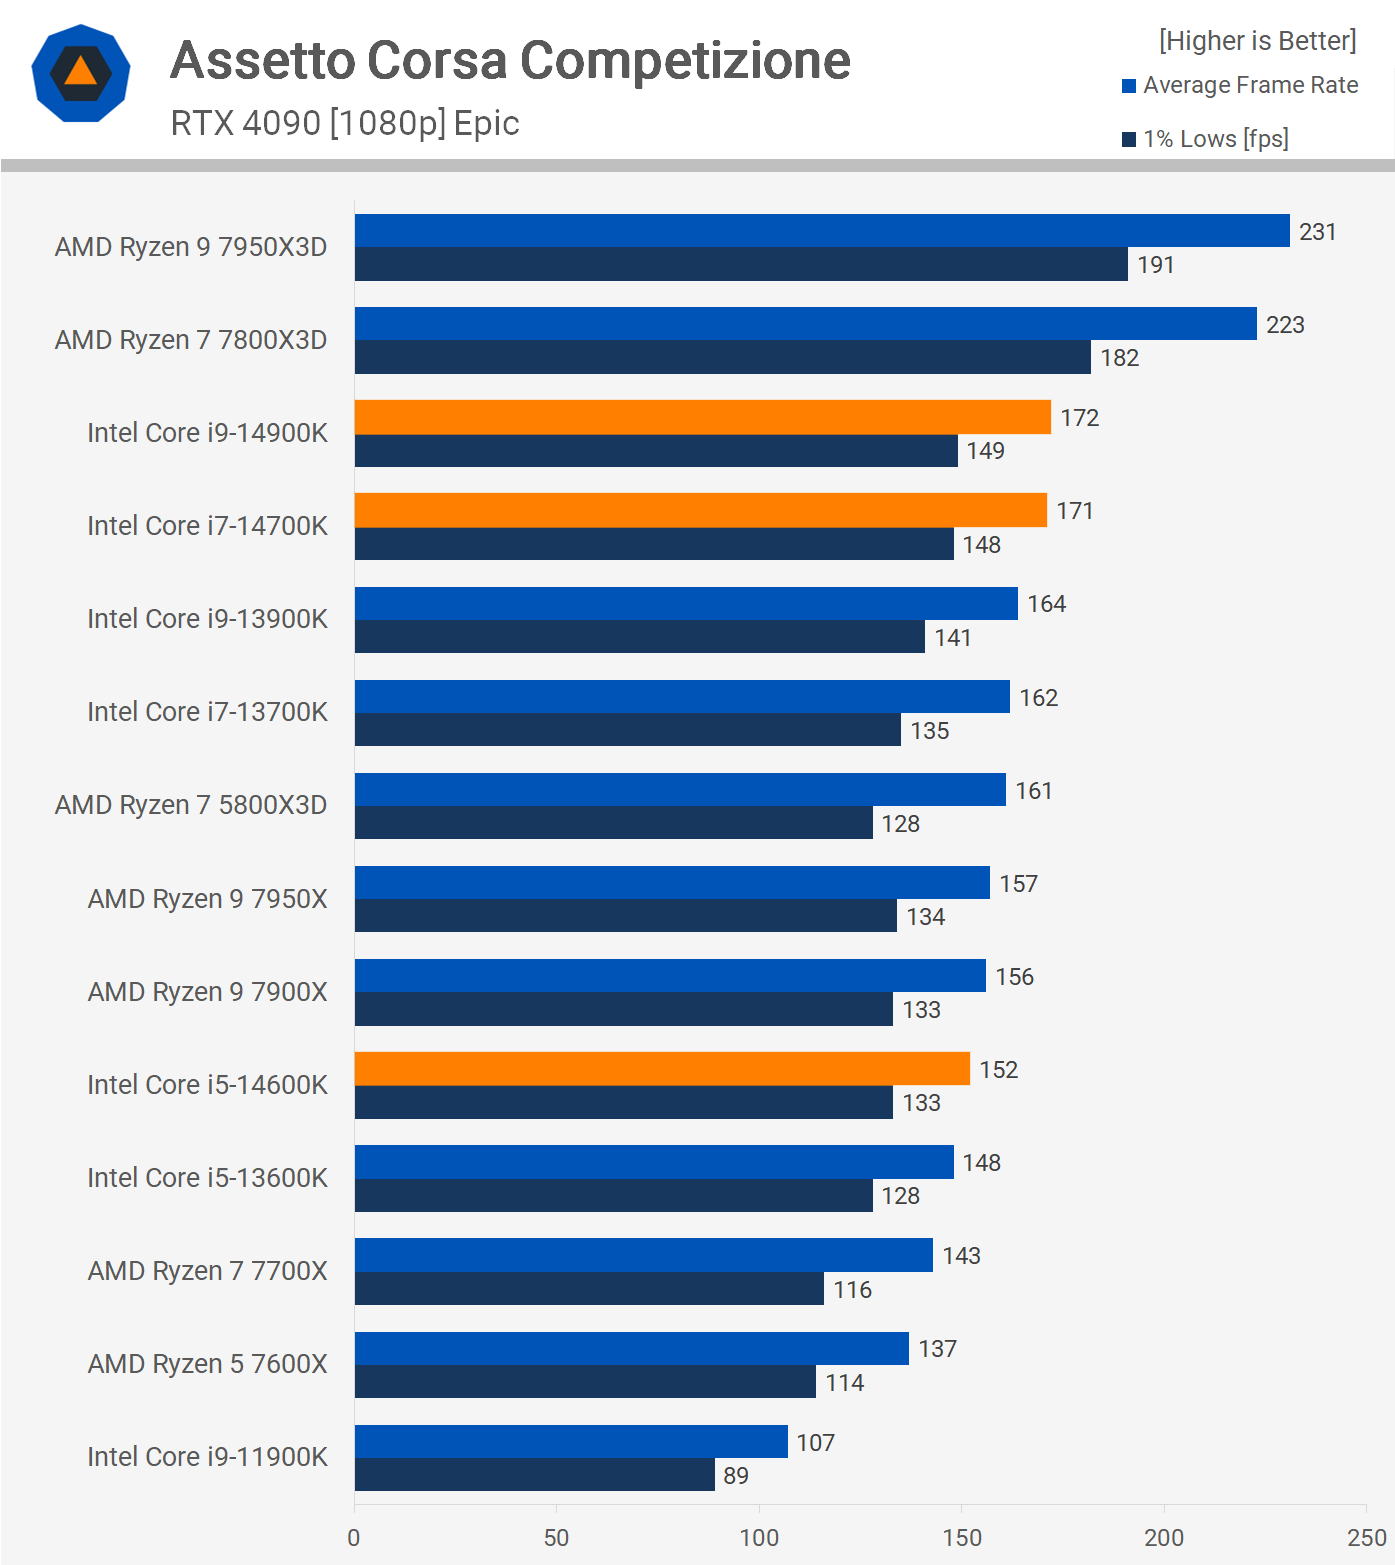
ACC, a title known to optimize 3D V-Cache processors, didn’t disappoint in this analysis. The 7800X3D exceeded the 14900K and 14700K by a significant 30%. However, the performance leap from the 13th to the 14th gen was negligible. In comparison to standard Zen 4 CPUs, the Raptor Lake series was impressive, with the 14900K being 10% swifter than the 7950X.
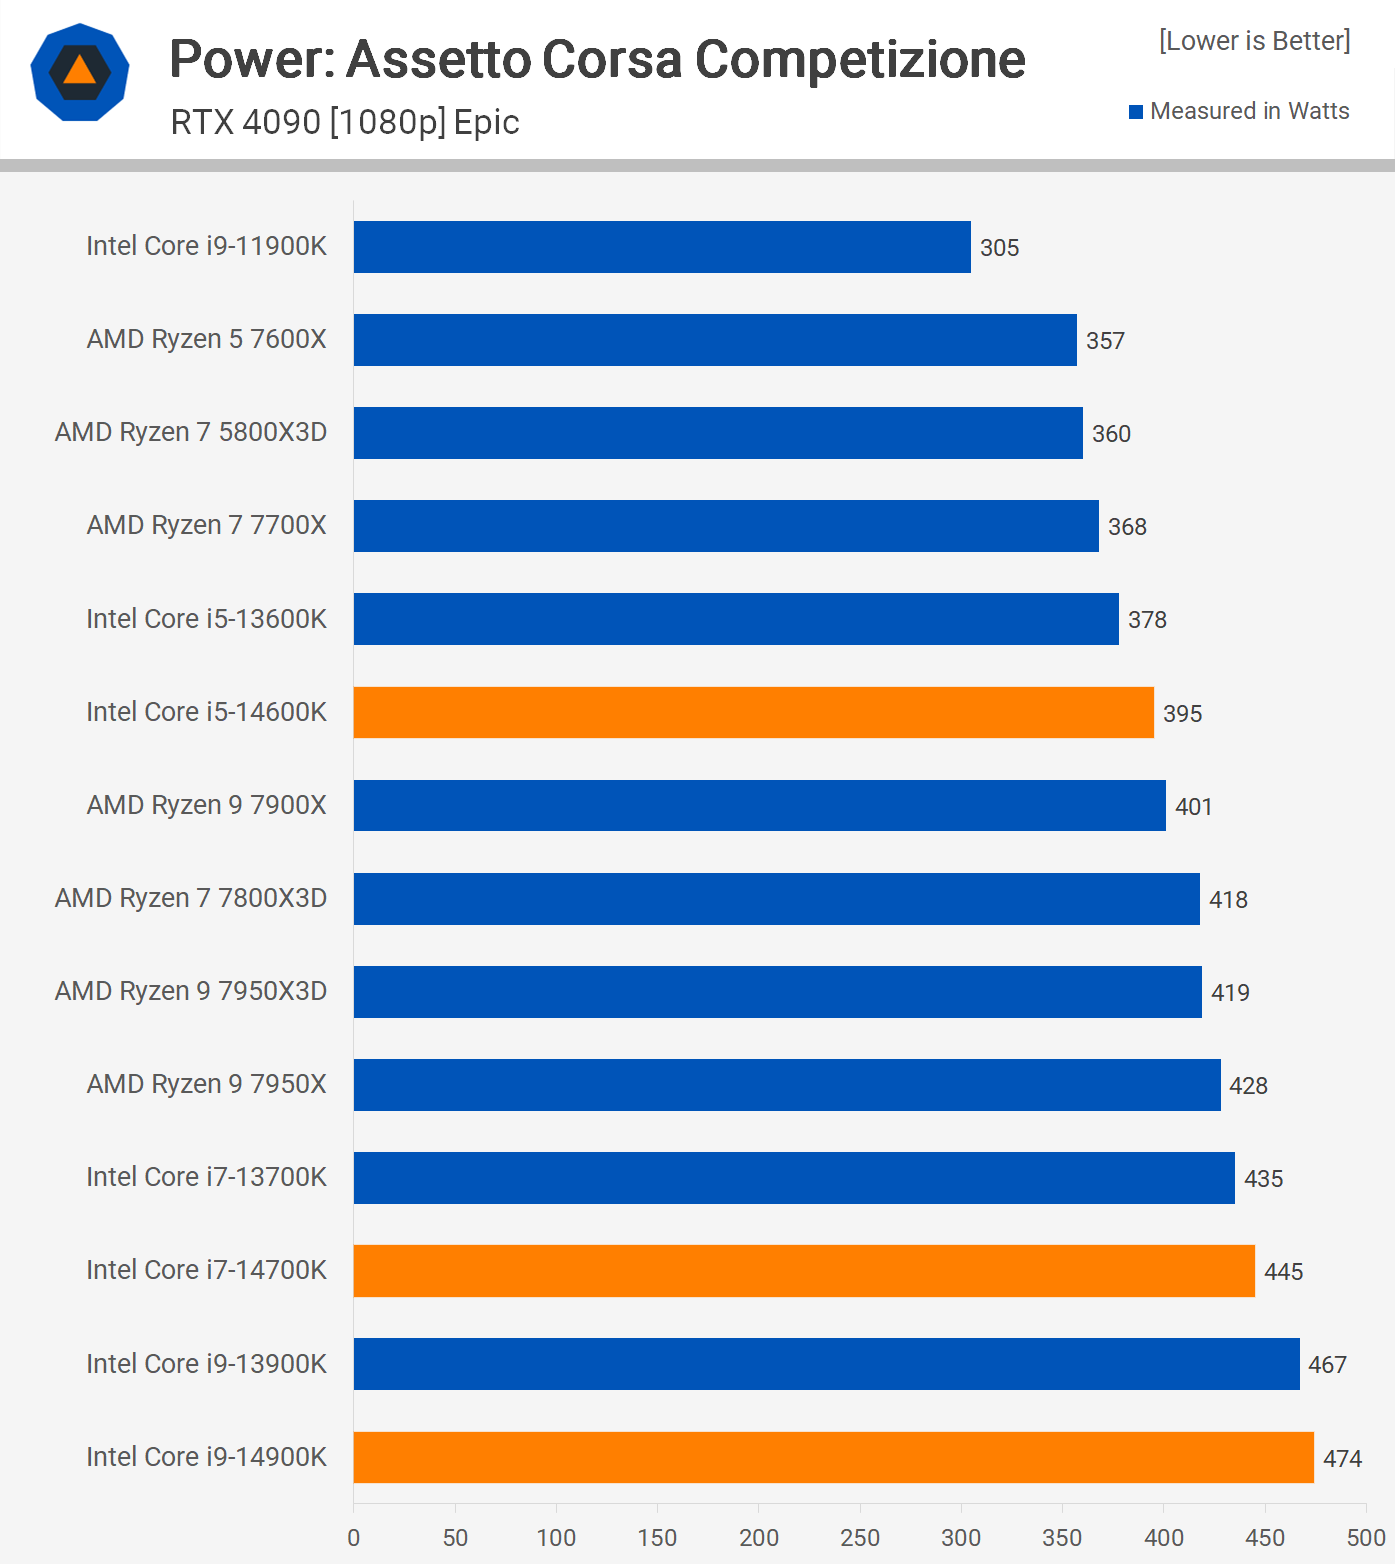
Considering the dominating performance of the 3D V-Cache CPUs in ACC, it’s expected they’d be more power-efficient. The 14900K’s system usage rose by only 13%, primarily because ACC doesn’t demand many threads.
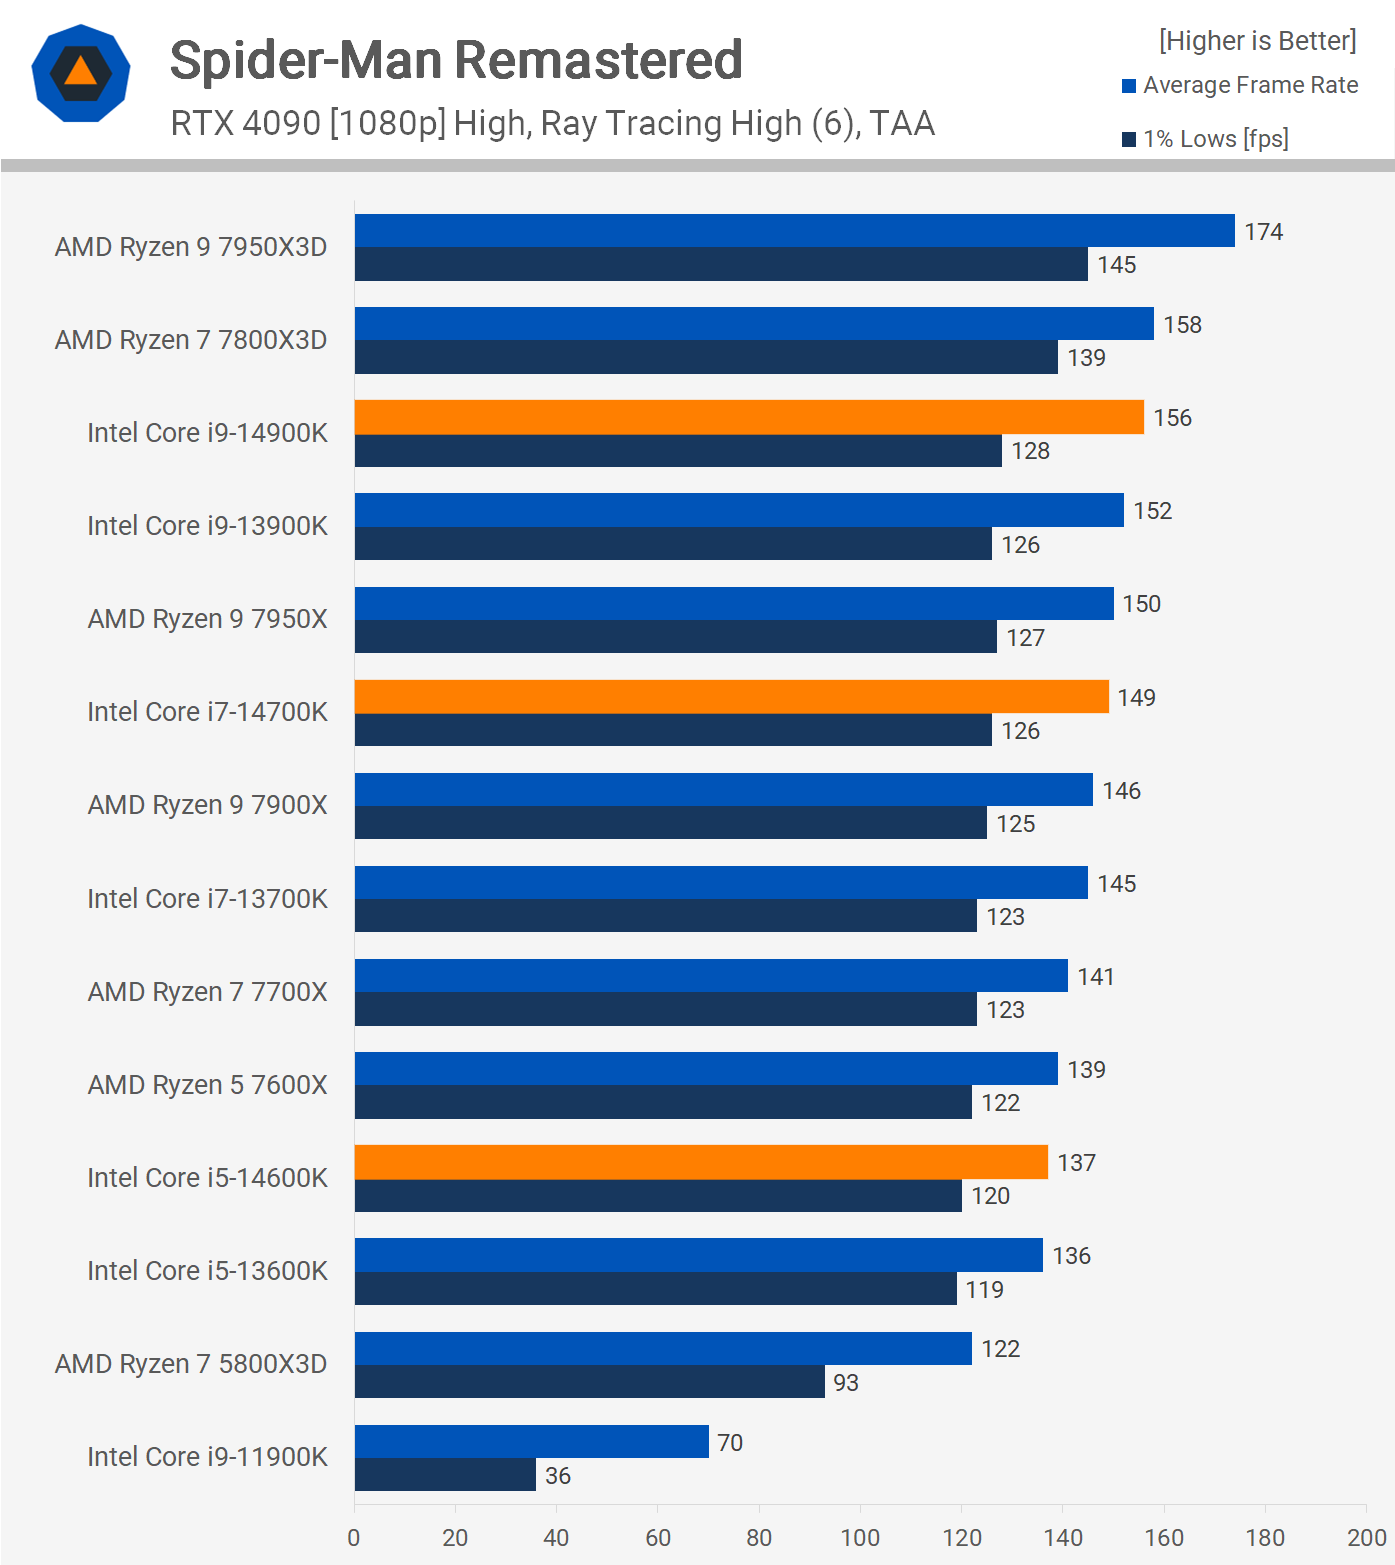
In Spider-Man Remastered, with high settings and quality ray tracing, the 14th gen components barely edged out their 13th gen counterparts. Consequently, the 14900K didn’t surpass the 7800X3D and was significantly behind the 7950X3D.
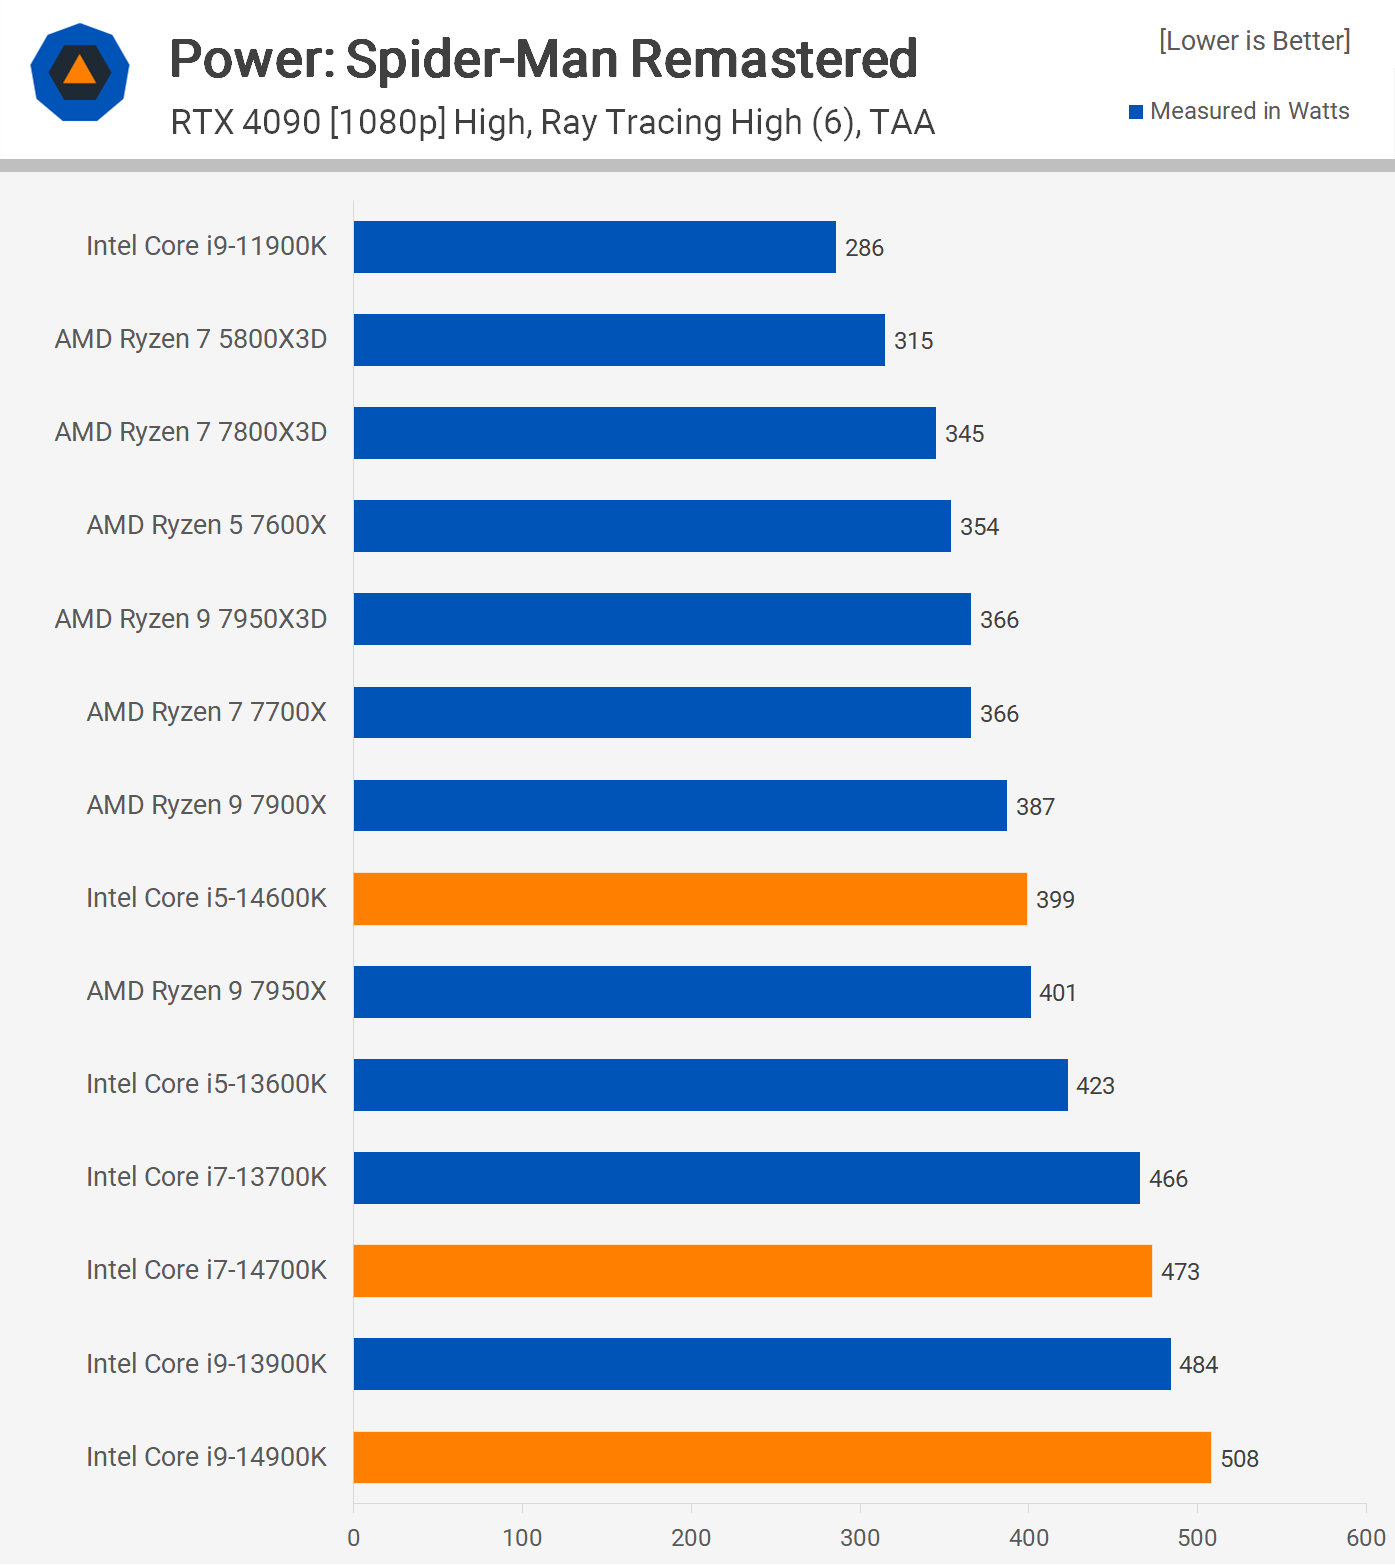
In this scenario, the 14900K’s system power consumption surged by nearly 50% compared to the 7800X3D, which is striking. Even against the superior 7950X3D, there was a nearly 40% uptick in total system power requirements, a surprising figure.
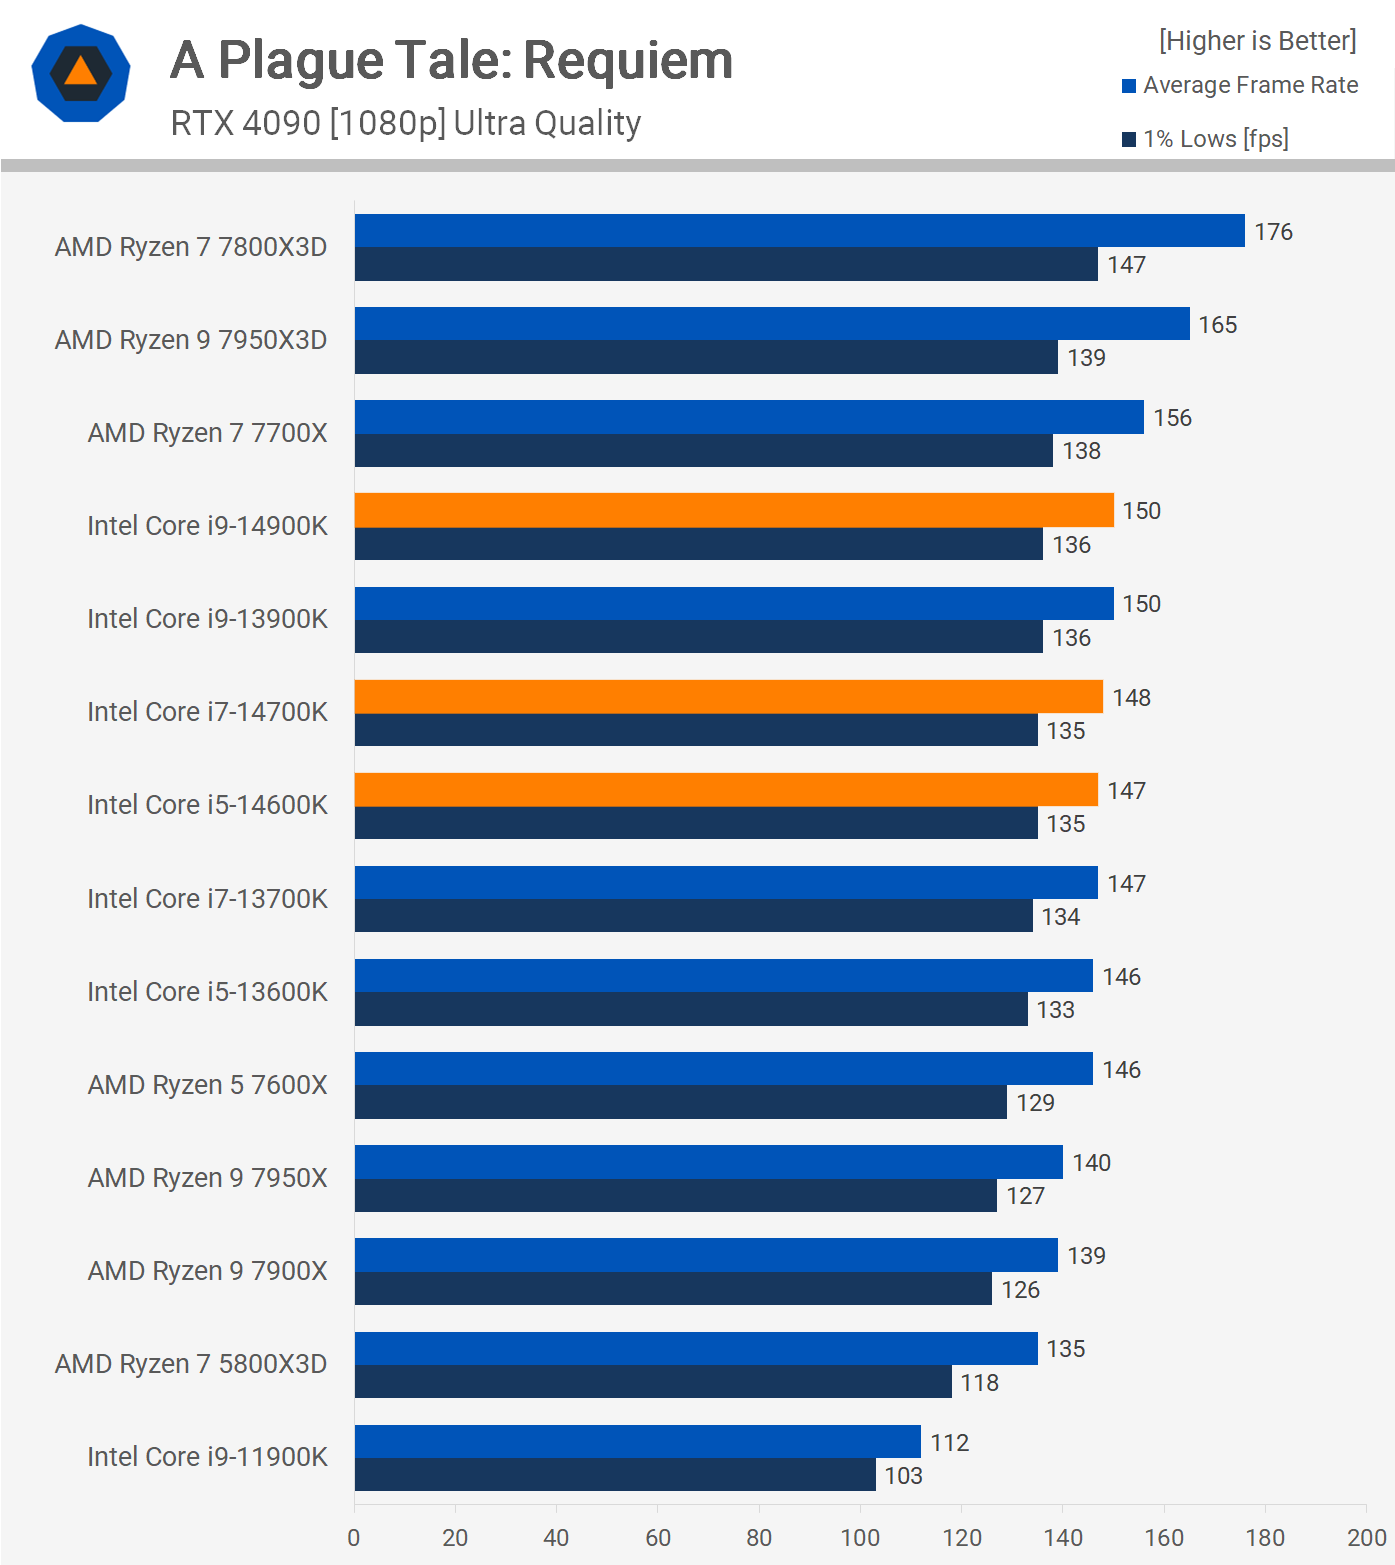
For A Plague Tale: Requiem, the latest 14th gen CPUs didn’t offer much over their 13th gen siblings. This put the 14900K’s performance at an average of 150 fps, trailing behind the 7700X and 15% behind the 7800X3D. The 14900K, 14700K, and 14600K had comparable outcomes, a trend seen in the 13th gen models as well.
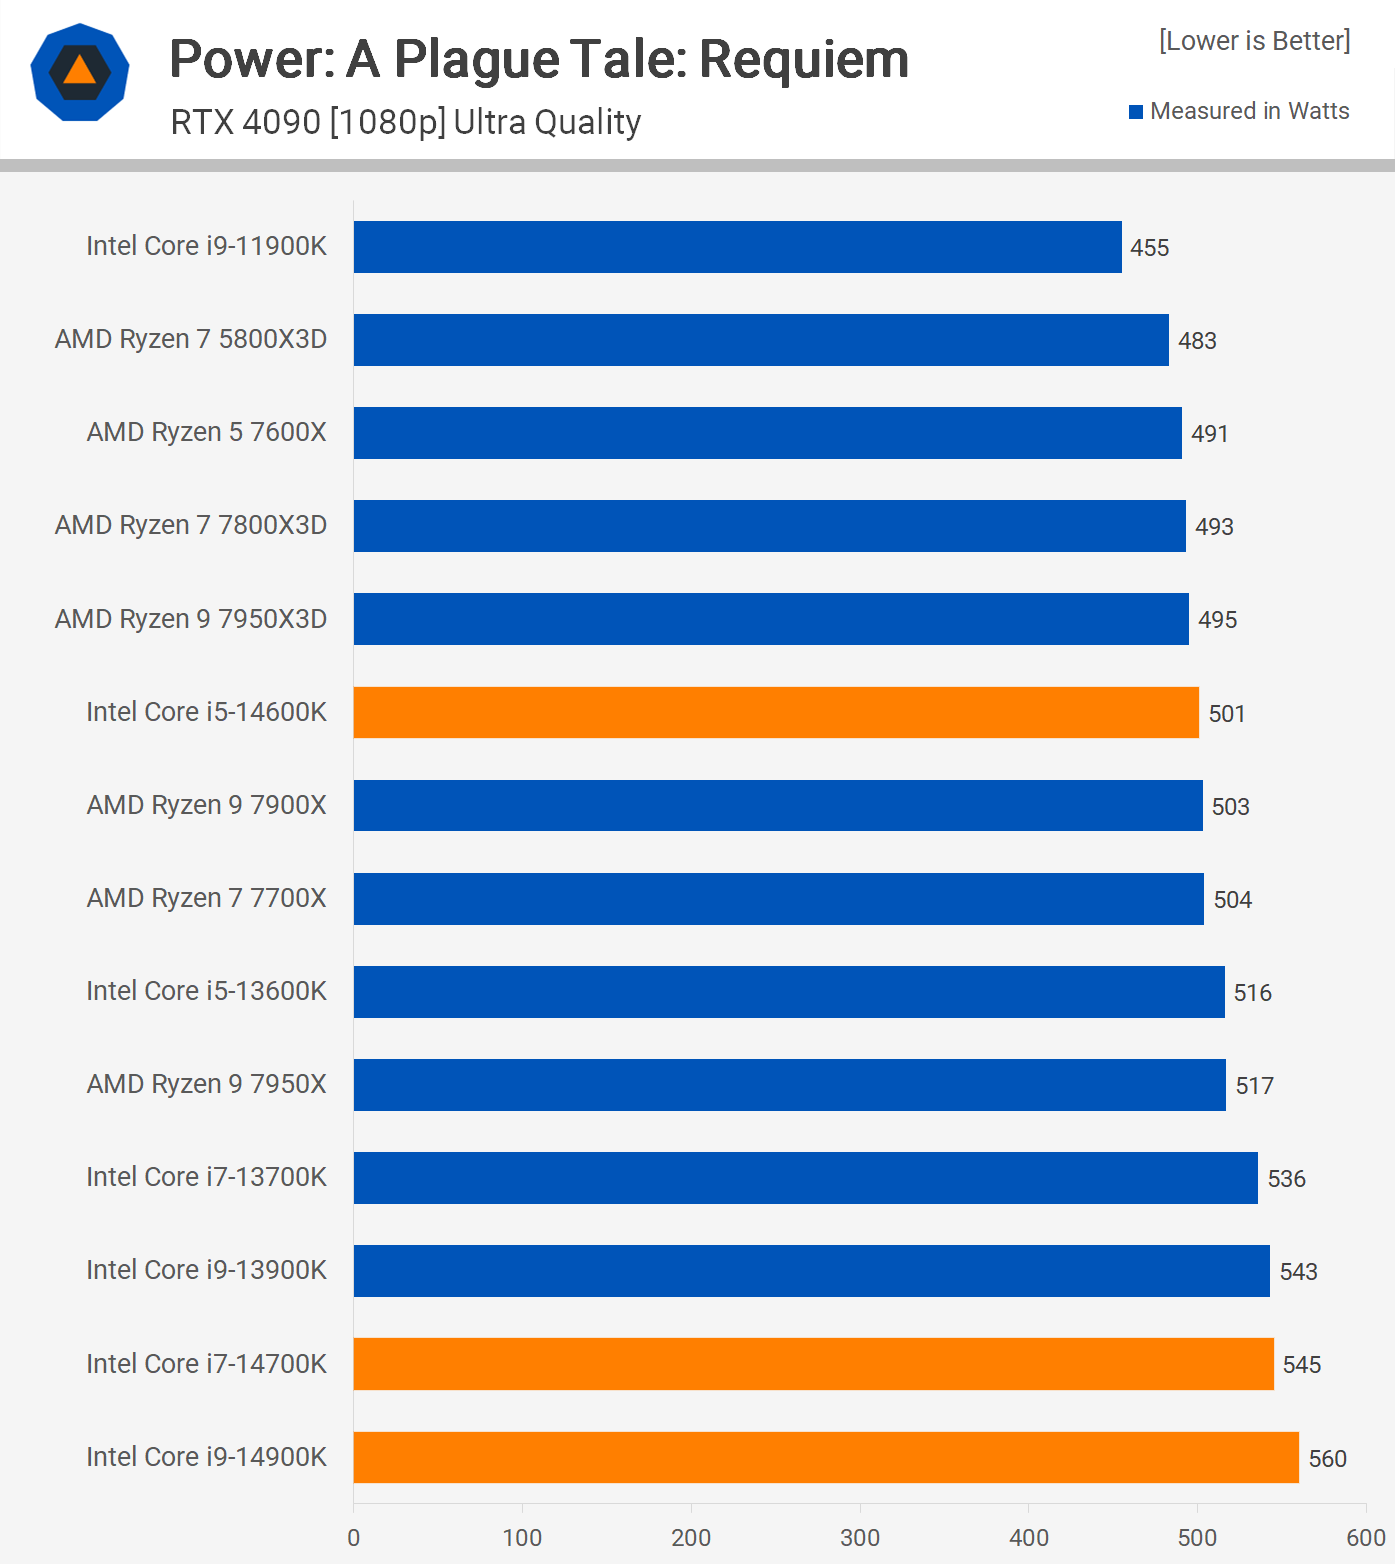
Power consumption in A Plague Tale: Requiem wasn’t as concerning as in other games. While the 7800X3D outpaced others, the 14900K’s system usage was only 14% greater, a relatively moderate increase in light of other comparisons.
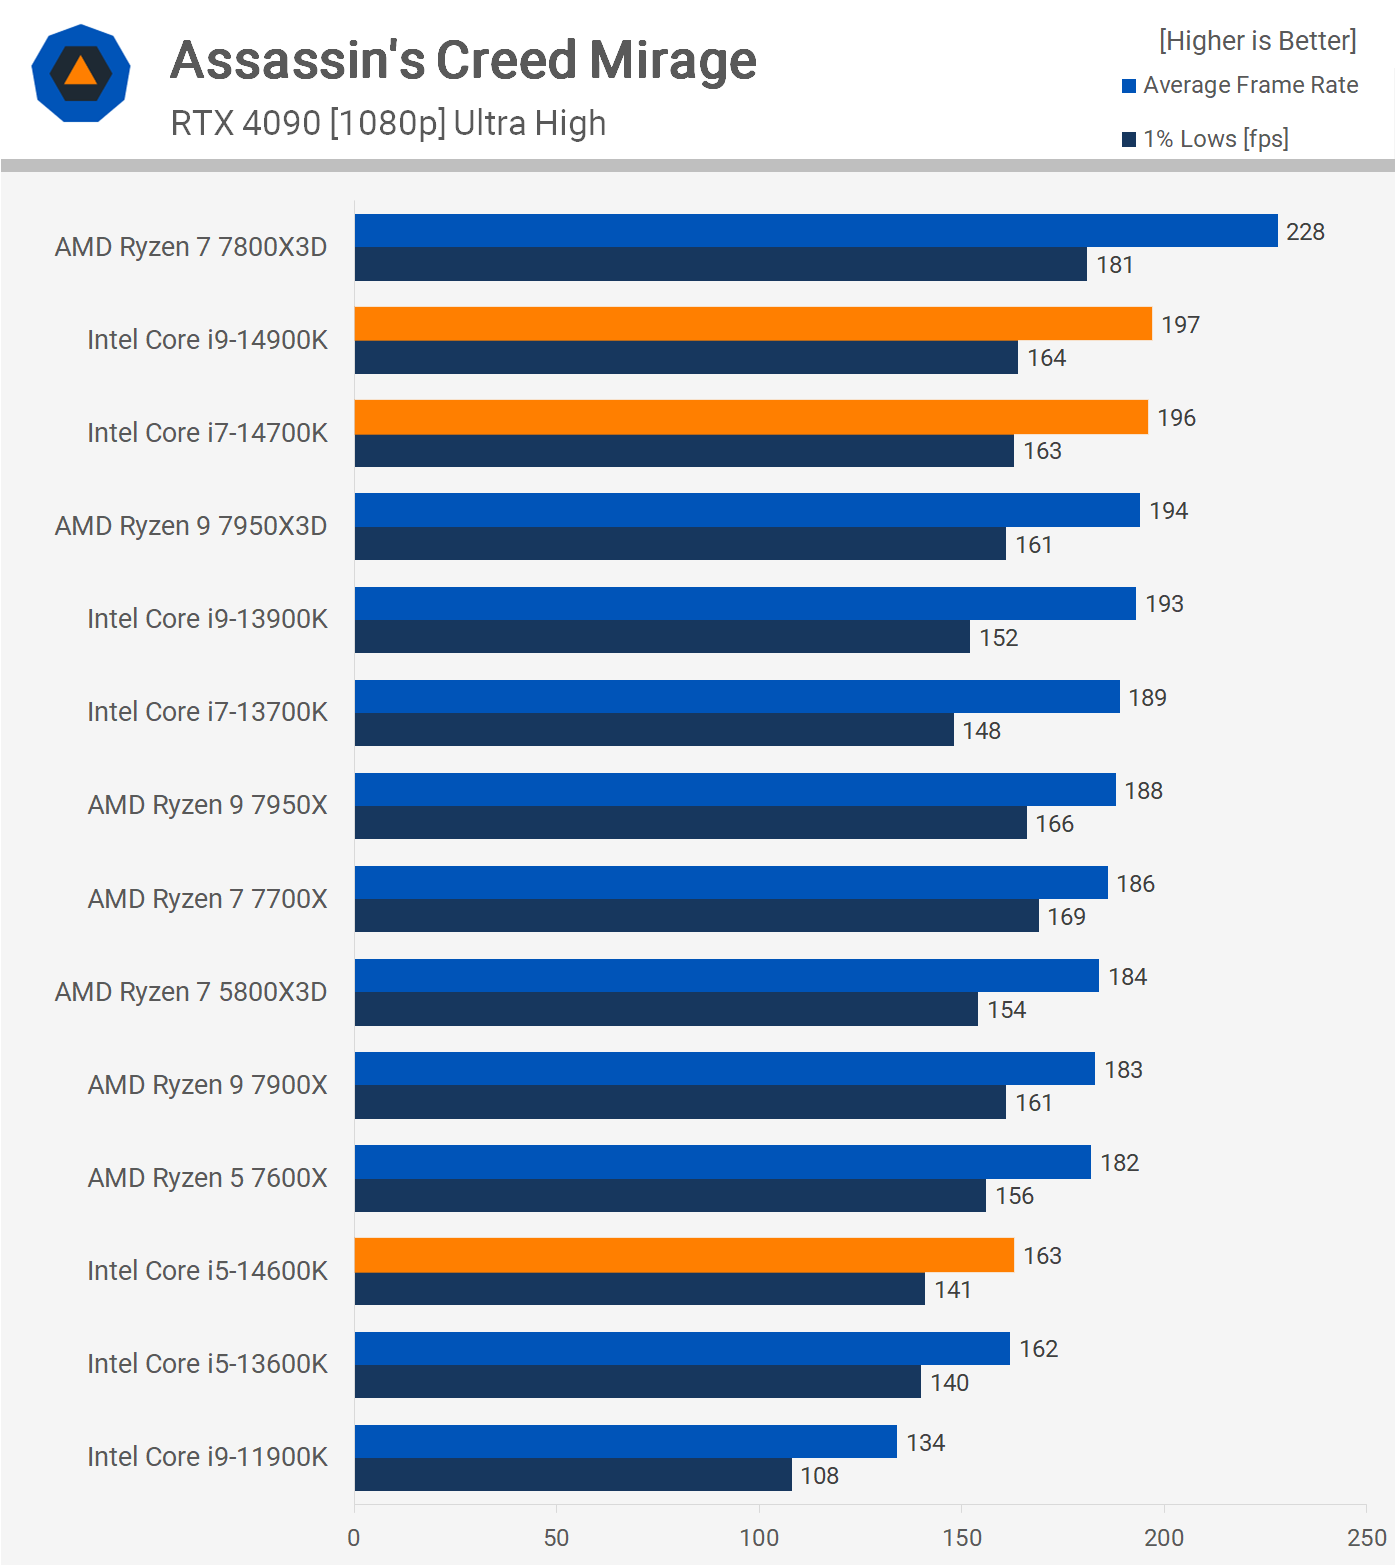
Assassin’s Creed Mirage should be a playground for the 7950X3D, mirroring the supremacy of the 7800X3D. However, there seems to be a scheduling discrepancy, making it only marginally swifter than the standard 7950X. Nevertheless, the 7950X3D held its ground, equating to the performance of the 14700K and 14900K. Meanwhile, the 7800X3D outperformed Intel’s latest flagship by 16%.
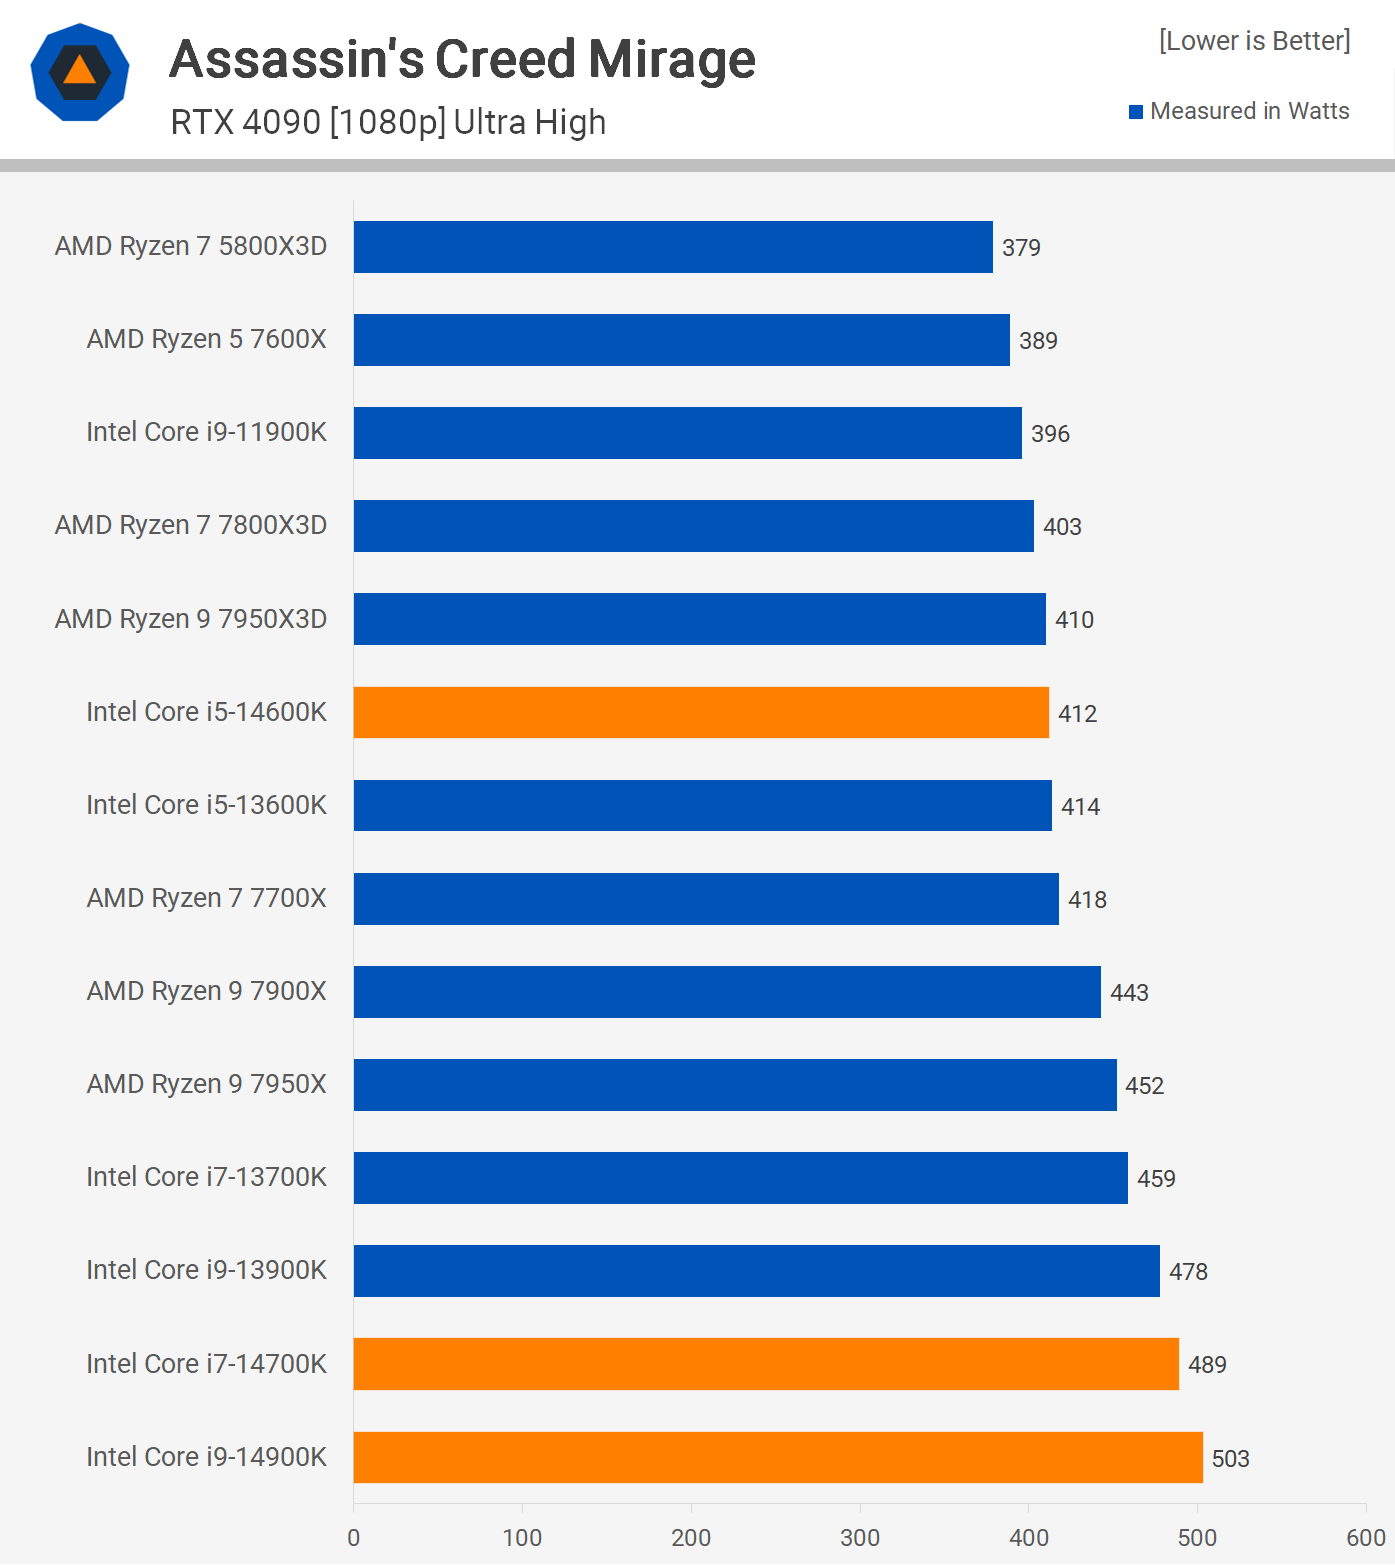
Yet again, power remains the Achilles heel for the Raptor Lake CPUs. The 14900K raised total system consumption to 503 watts, a mark 25% loftier than the 7800X3D, even though the Ryzen processor was 16% swifter.
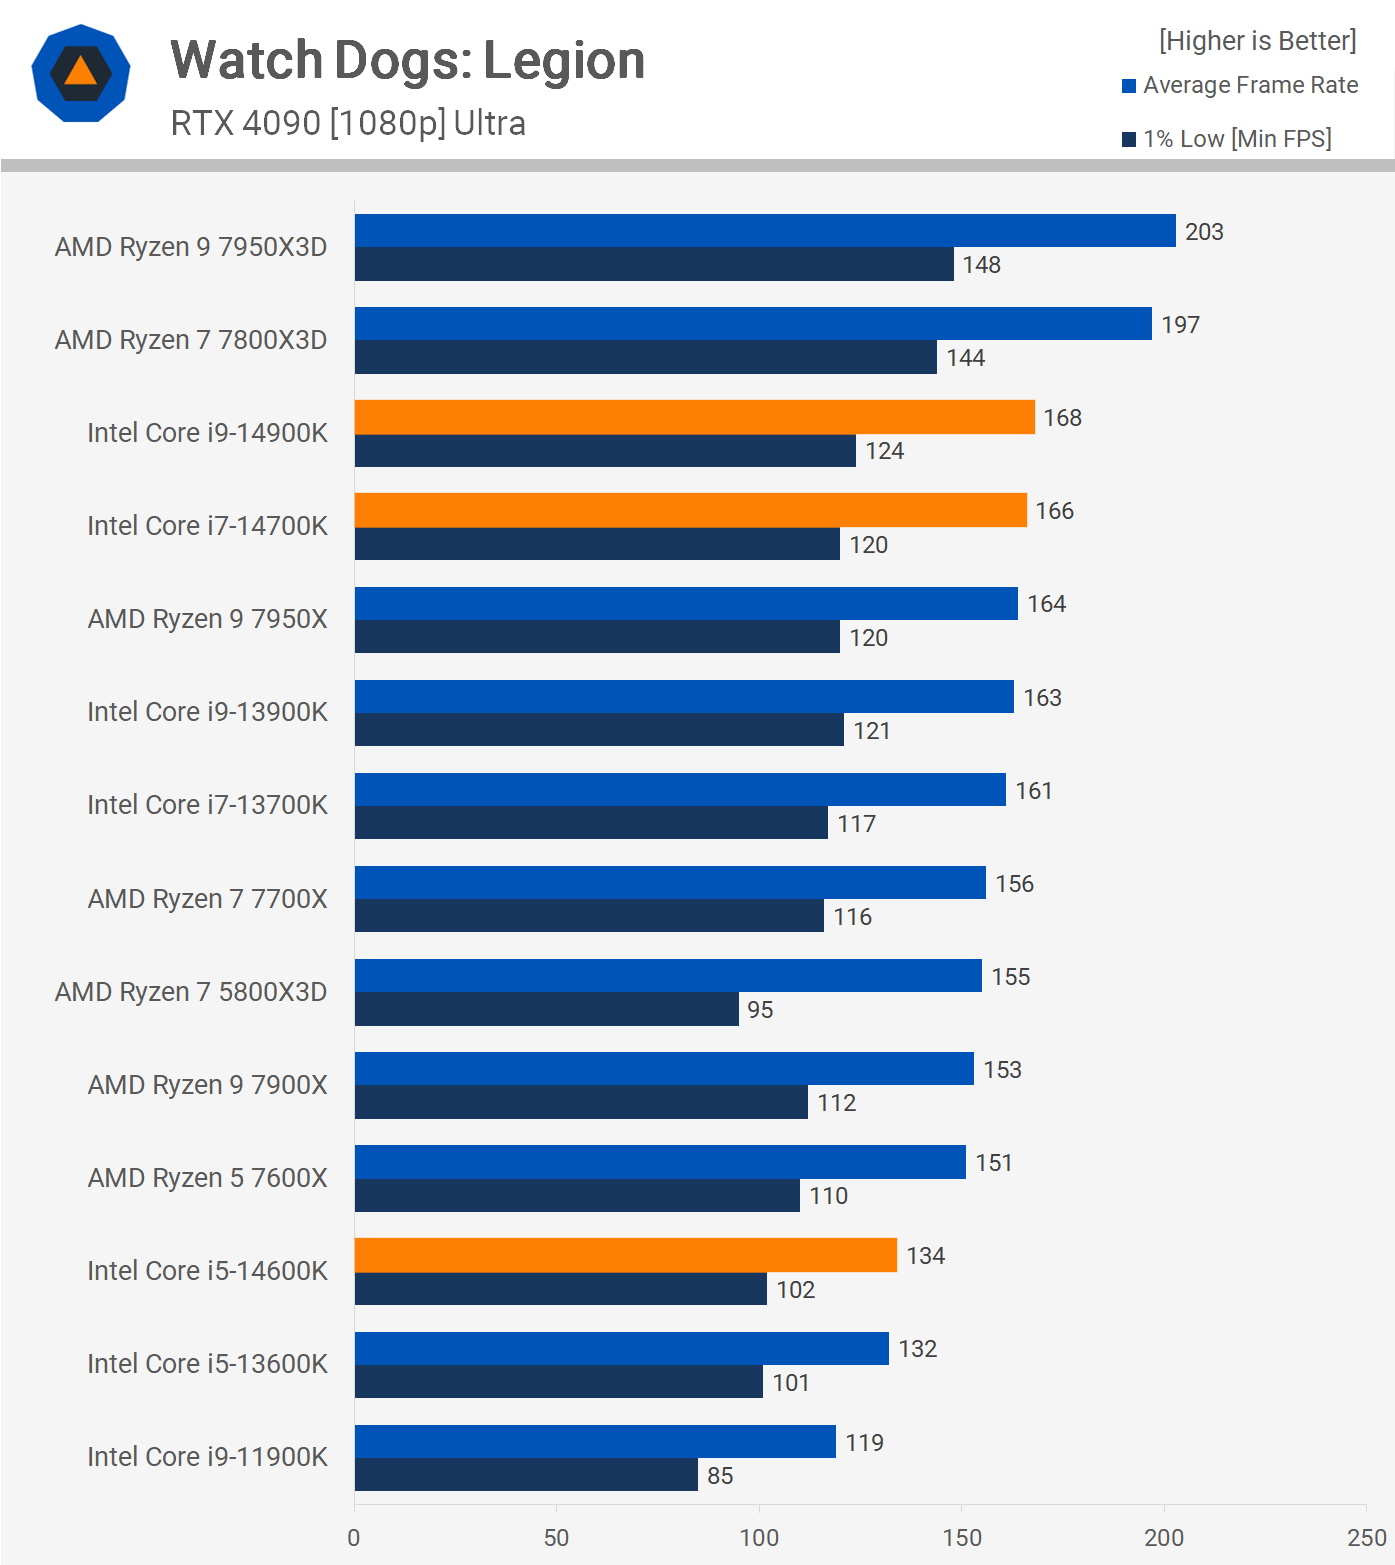
Watch Dogs: Legion showcases another striking performance from the X3D chips, pushing the RTX 4090 to nearly 200 fps at ultra quality settings. By comparison, the 14900K outstripped the 13900K by a mere 3%, rendering the 7800X3D and 7950X3D faster by 17% and 21% respectively. The 14600K lagged behind in this title, with the 7600X surpassing it by 13%.
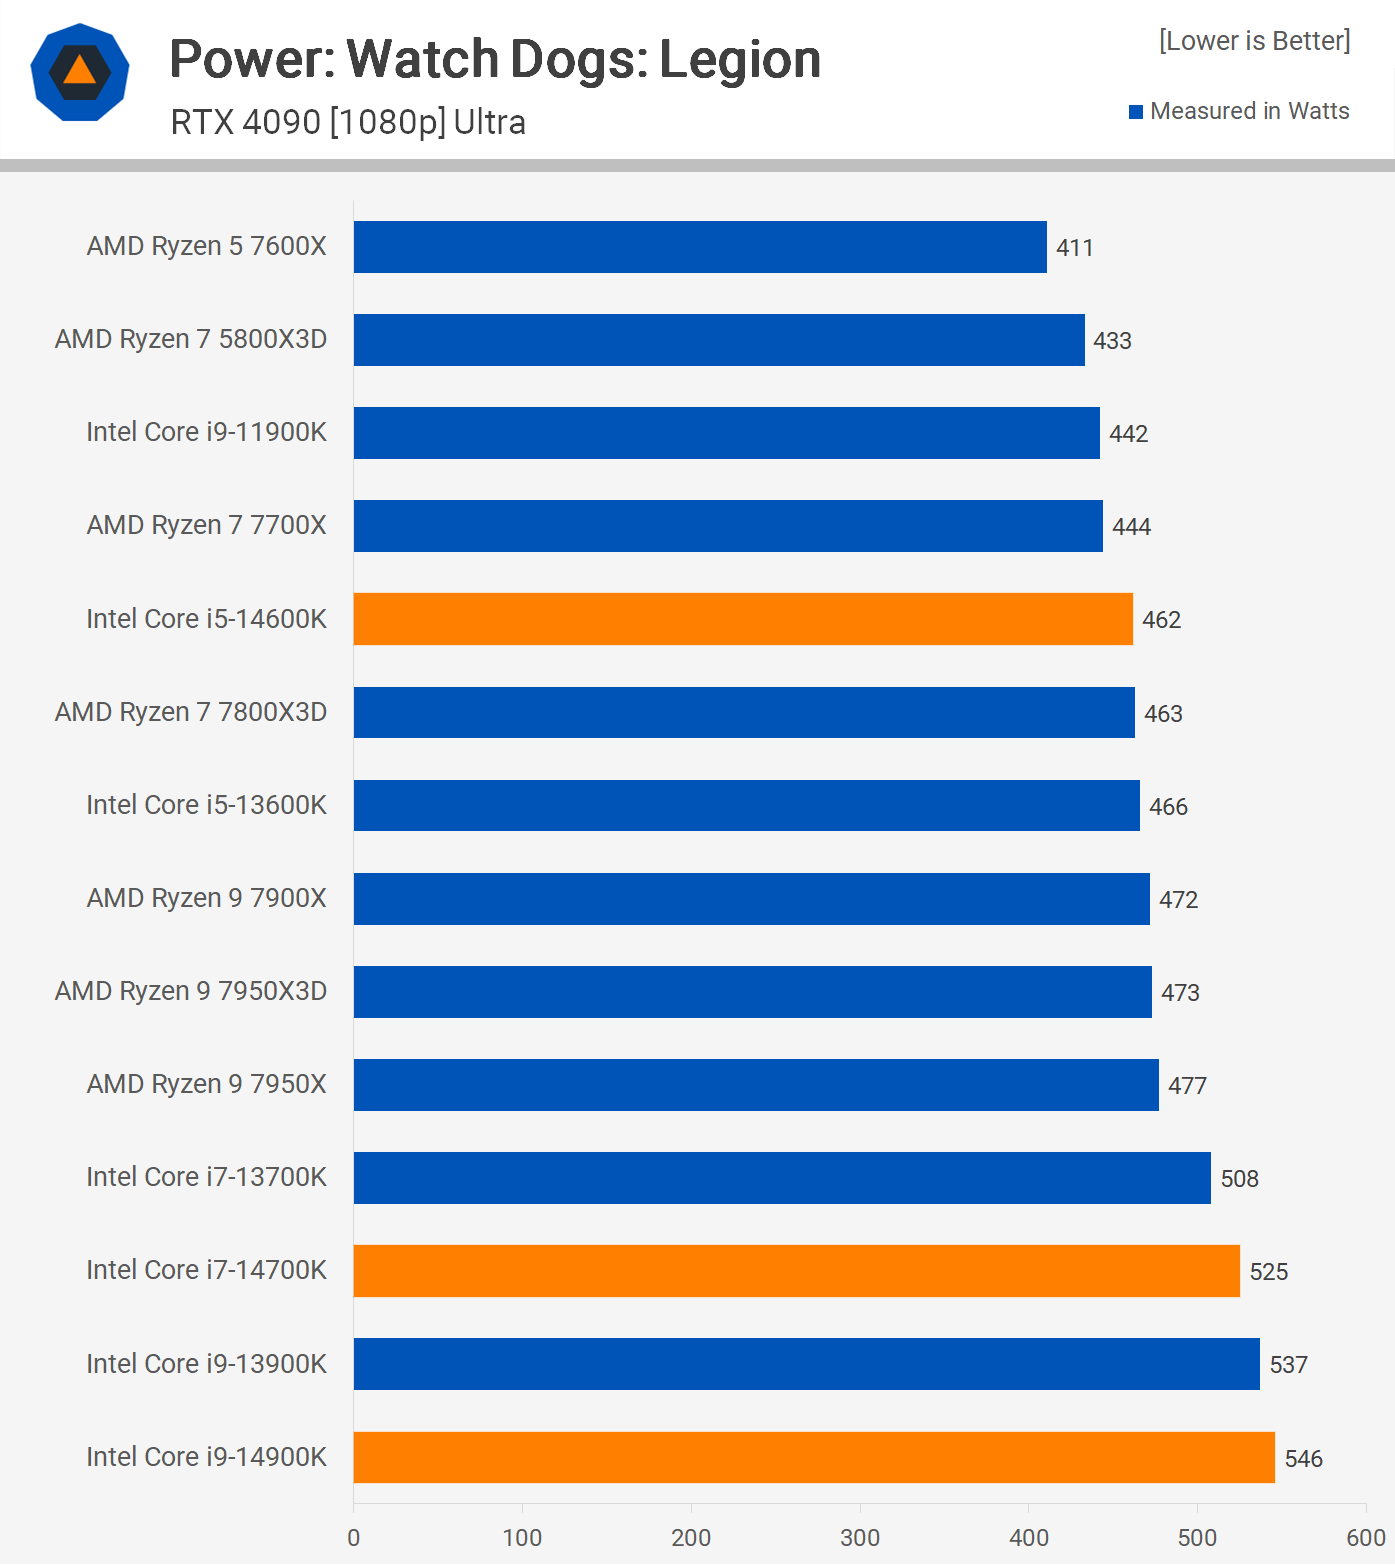
In terms of power consumption, both the 14600K and 7800X3D exhibited similar figures. This situates the 14900K as 18% more demanding in total system use.
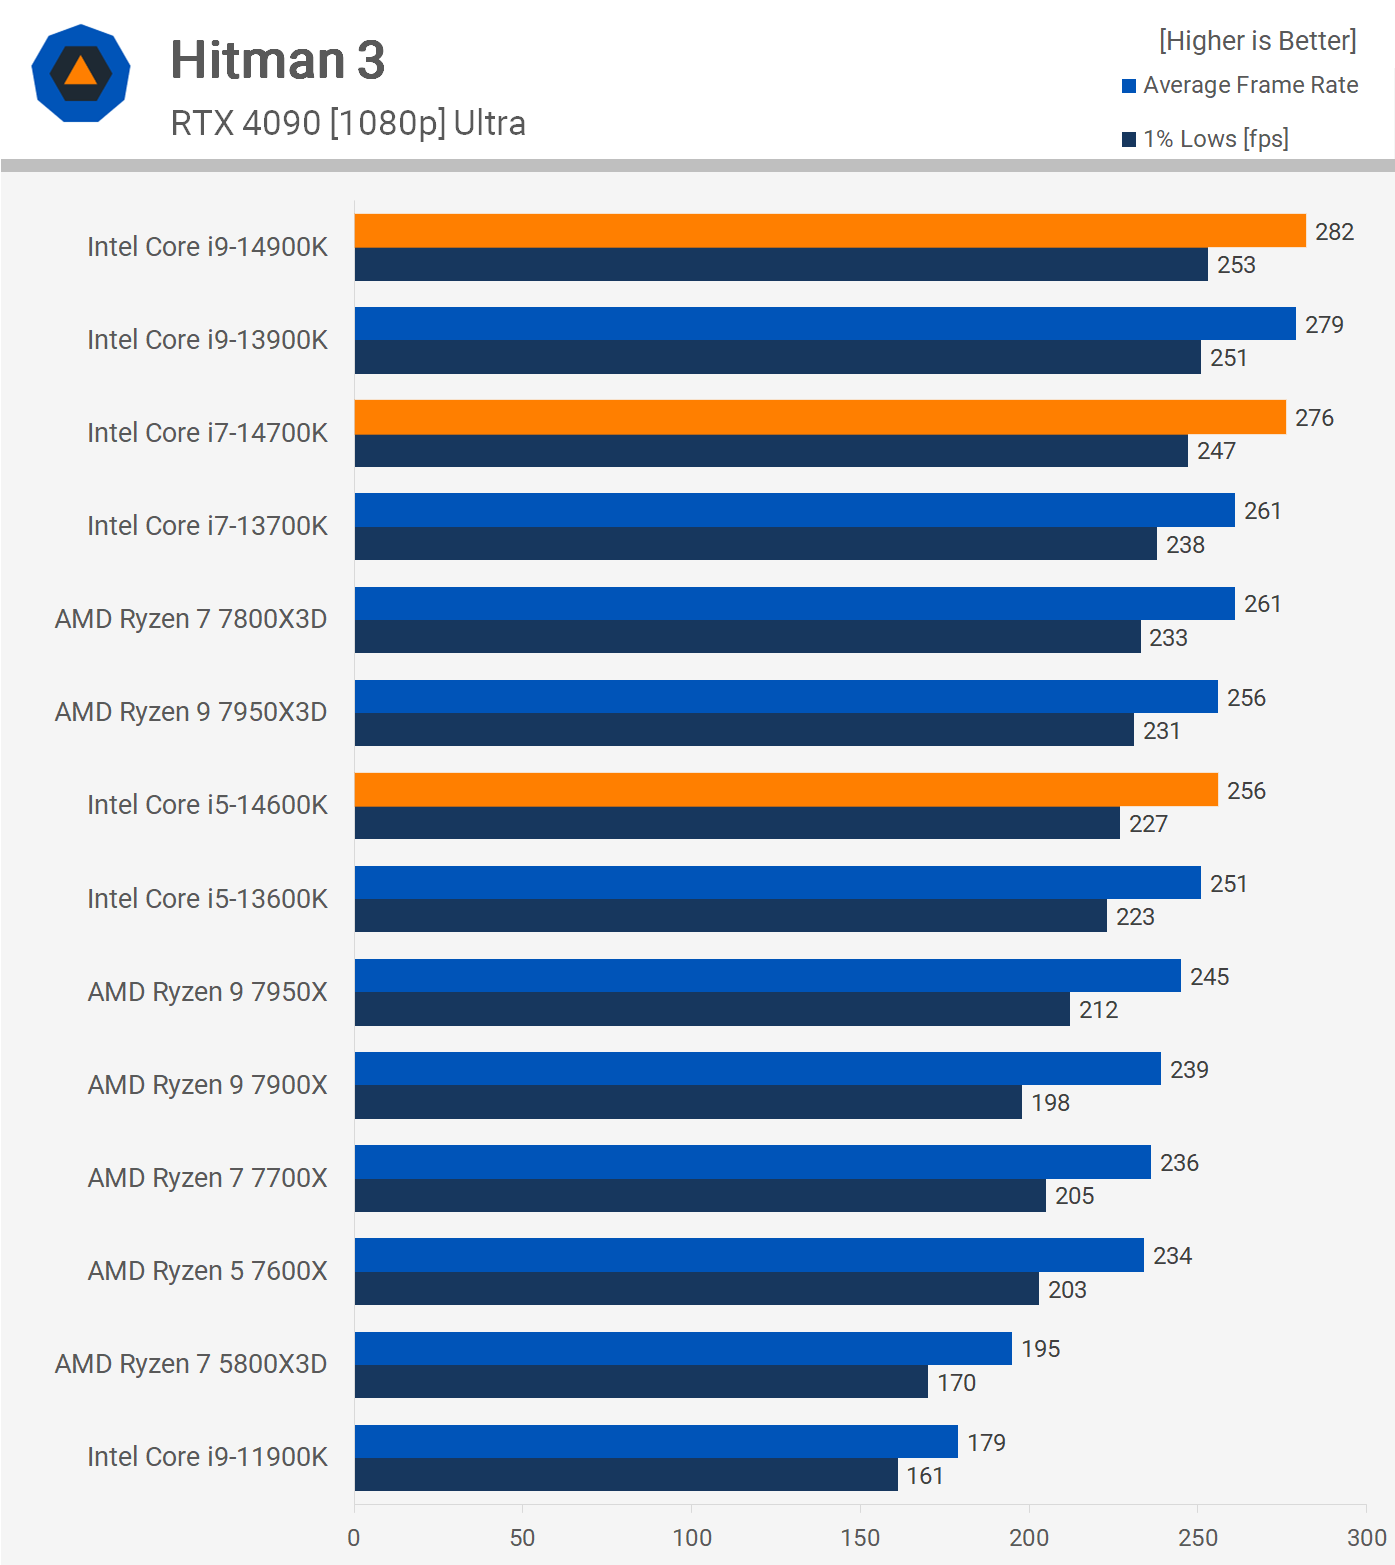
Transitioning to Hitman 3, the Intel processors exhibit commendable performance. However, the touted “new” 14th gen iterations don’t truly break new ground. To illustrate, the 14900K surpassed its 13th gen counterpart by only 1%, which translates to an 8% advantage over the 7800X3D.
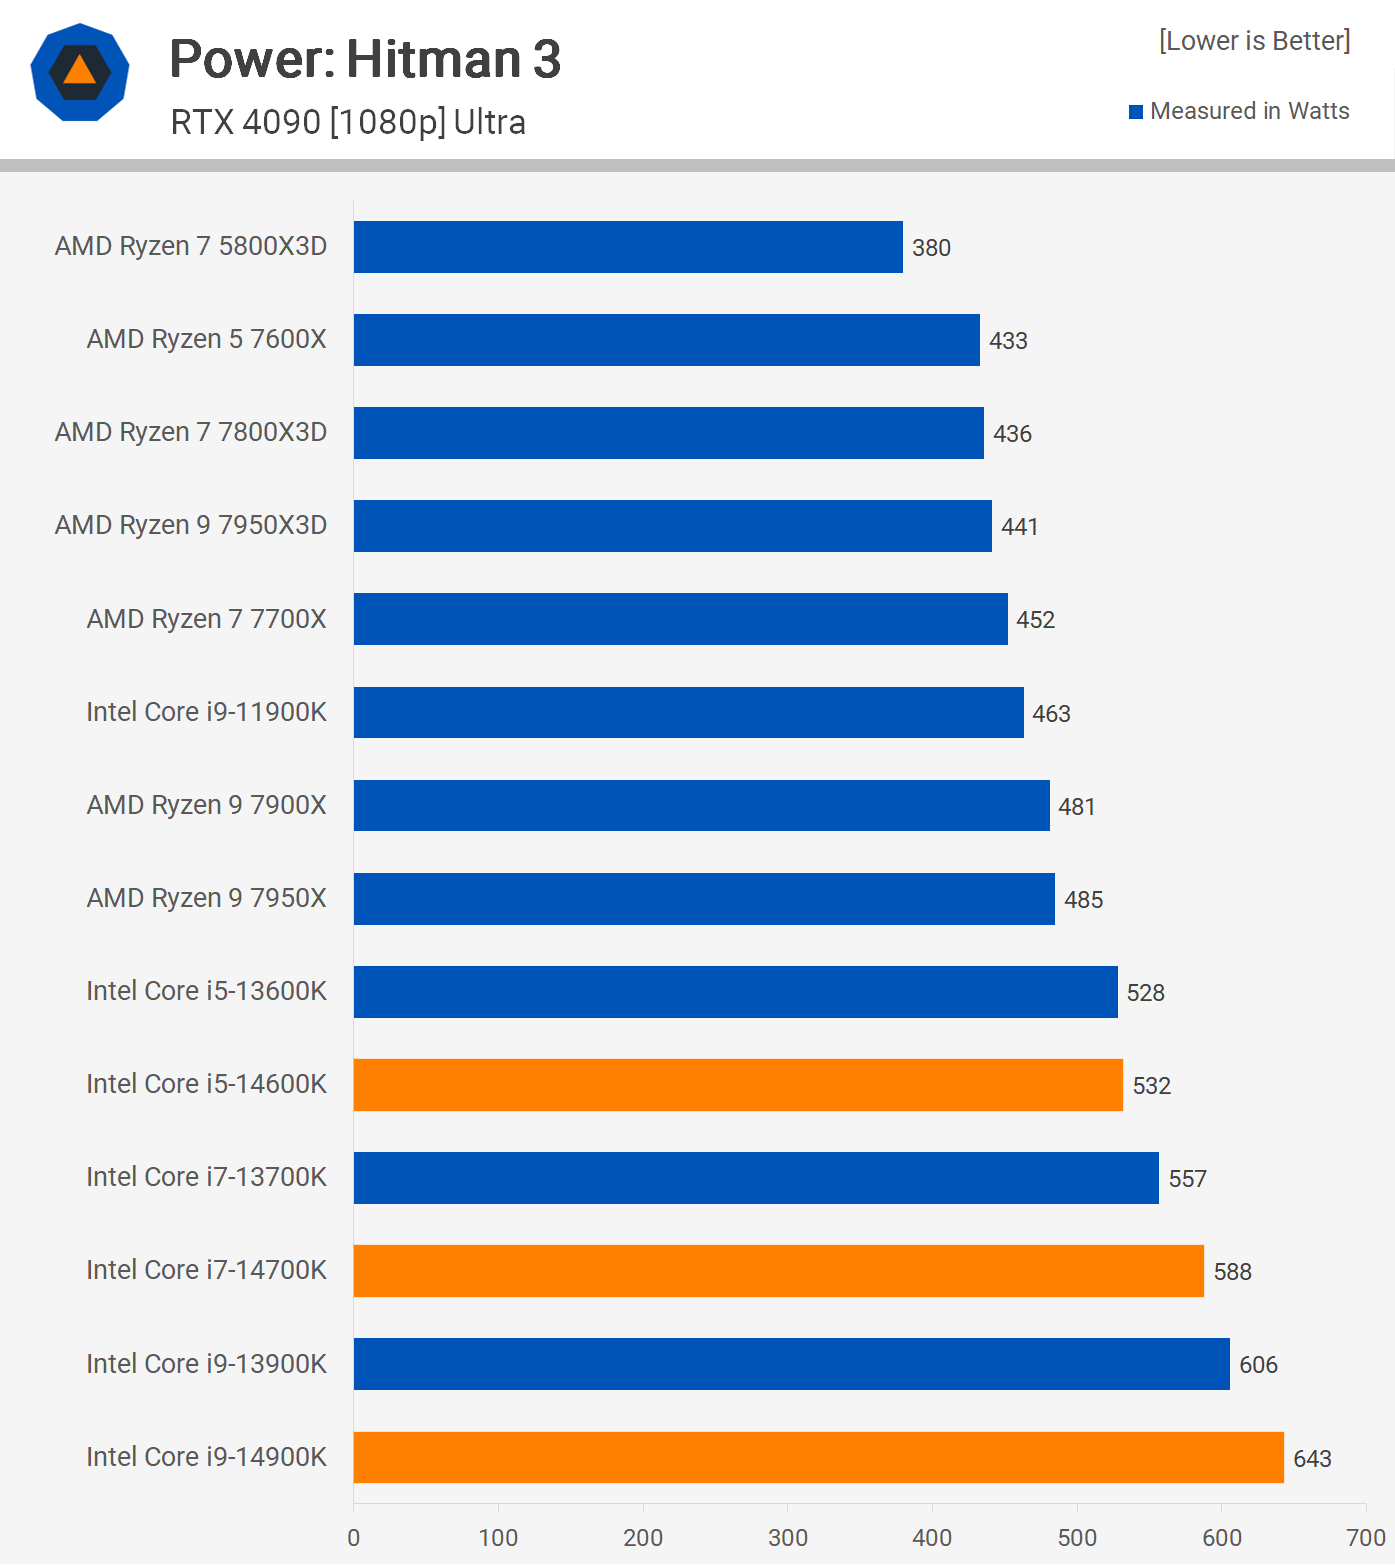
However, the power narrative remains unchanged. The 14900K’s power consumption escalated, increasing total system demand by a significant 47% compared to the 7800X3D. This leap in power for a modest 8% performance gain is indeed underwhelming.
12 Game Average
Here, we present the average data from 12 games, determined using the geomean. In previous evaluations, we observed that the 7800X3D outperformed the 13900K by 4% on average. This gap has now expanded to 10%. So, what caused this shift? While there have been some AGESA code updates contributing minor performance enhancements, the primary distinction lies in the games selected.
In our previous set, games like CSGO and The Riftbreaker were included, where the 7800X3D didn’t showcase its best performance. However, it’s worth noting that we also excluded Horizon Zero Dawn, which was favorable for the X3D chips.
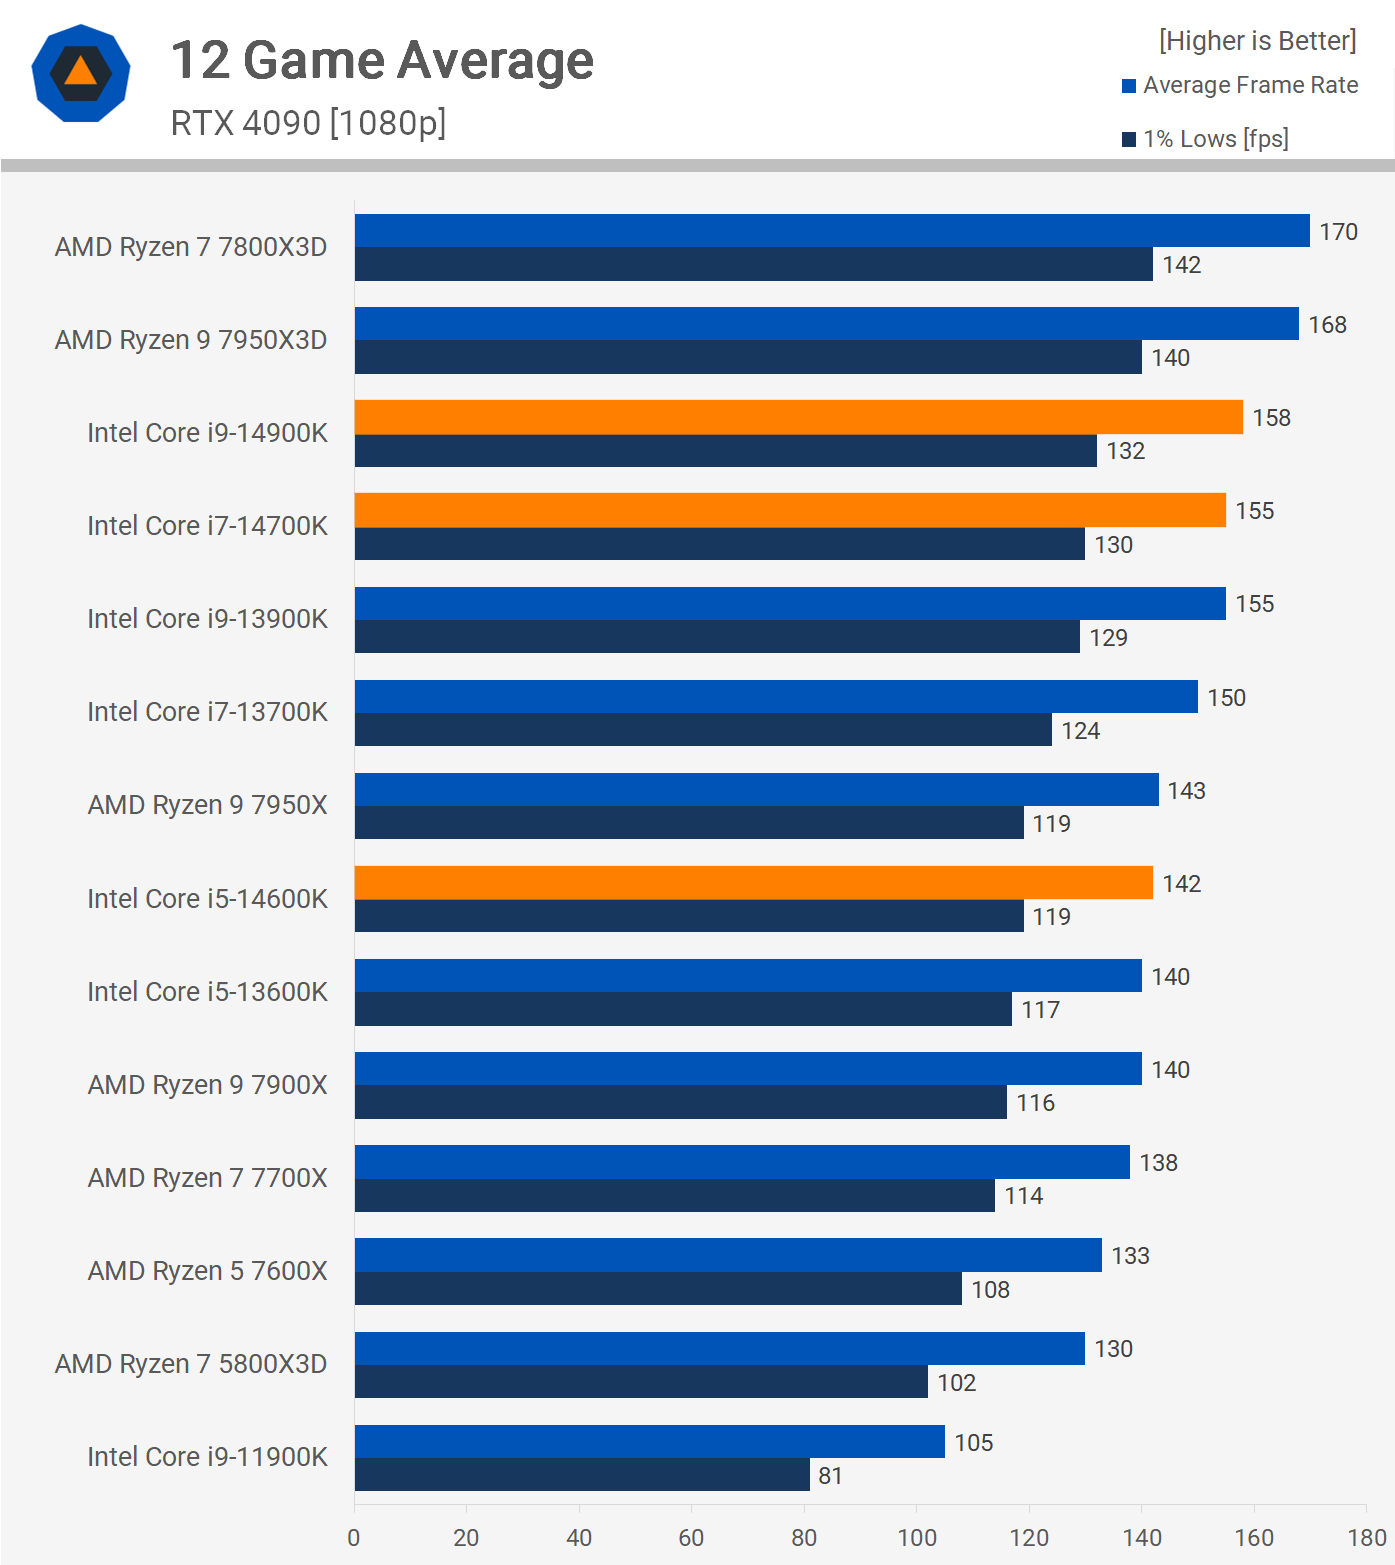
In our current test, most of the newly incorporated games displayed stellar performance on the X3D chips, particularly the 7800X3D. Titles like Assassin’s Creed Mirage, Baldur’s Gate 3, and Star Wars Jedi Survivor stood out, with Starfield being the only underwhelming performance for AMD.
Summarizing the results, the 7800X3D was 7% quicker than the 14900K and 10% faster than the 14700K. Meanwhile, the 14600K surpassed the 7700X by 4% and the 7600X by 8%. When compared with the 13th gen counterparts, both the 14900K and 14700K demonstrated a 3% speed advantage, while the 14600K was marginally better, at just 1% faster.
Nevertheless, the Core i5 version continues to offer good value and maintains a moderate stance on power consumption, which we will delve into next.
Power Consumption
This graph highlights Intel’s primary challenge at present: power consumption. The best-case scenario for Intel across a broad selection of games seems to be the 7800X3D and 14900K performing comparably. However, to achieve this parity, the Intel system consumes around 30% more power.
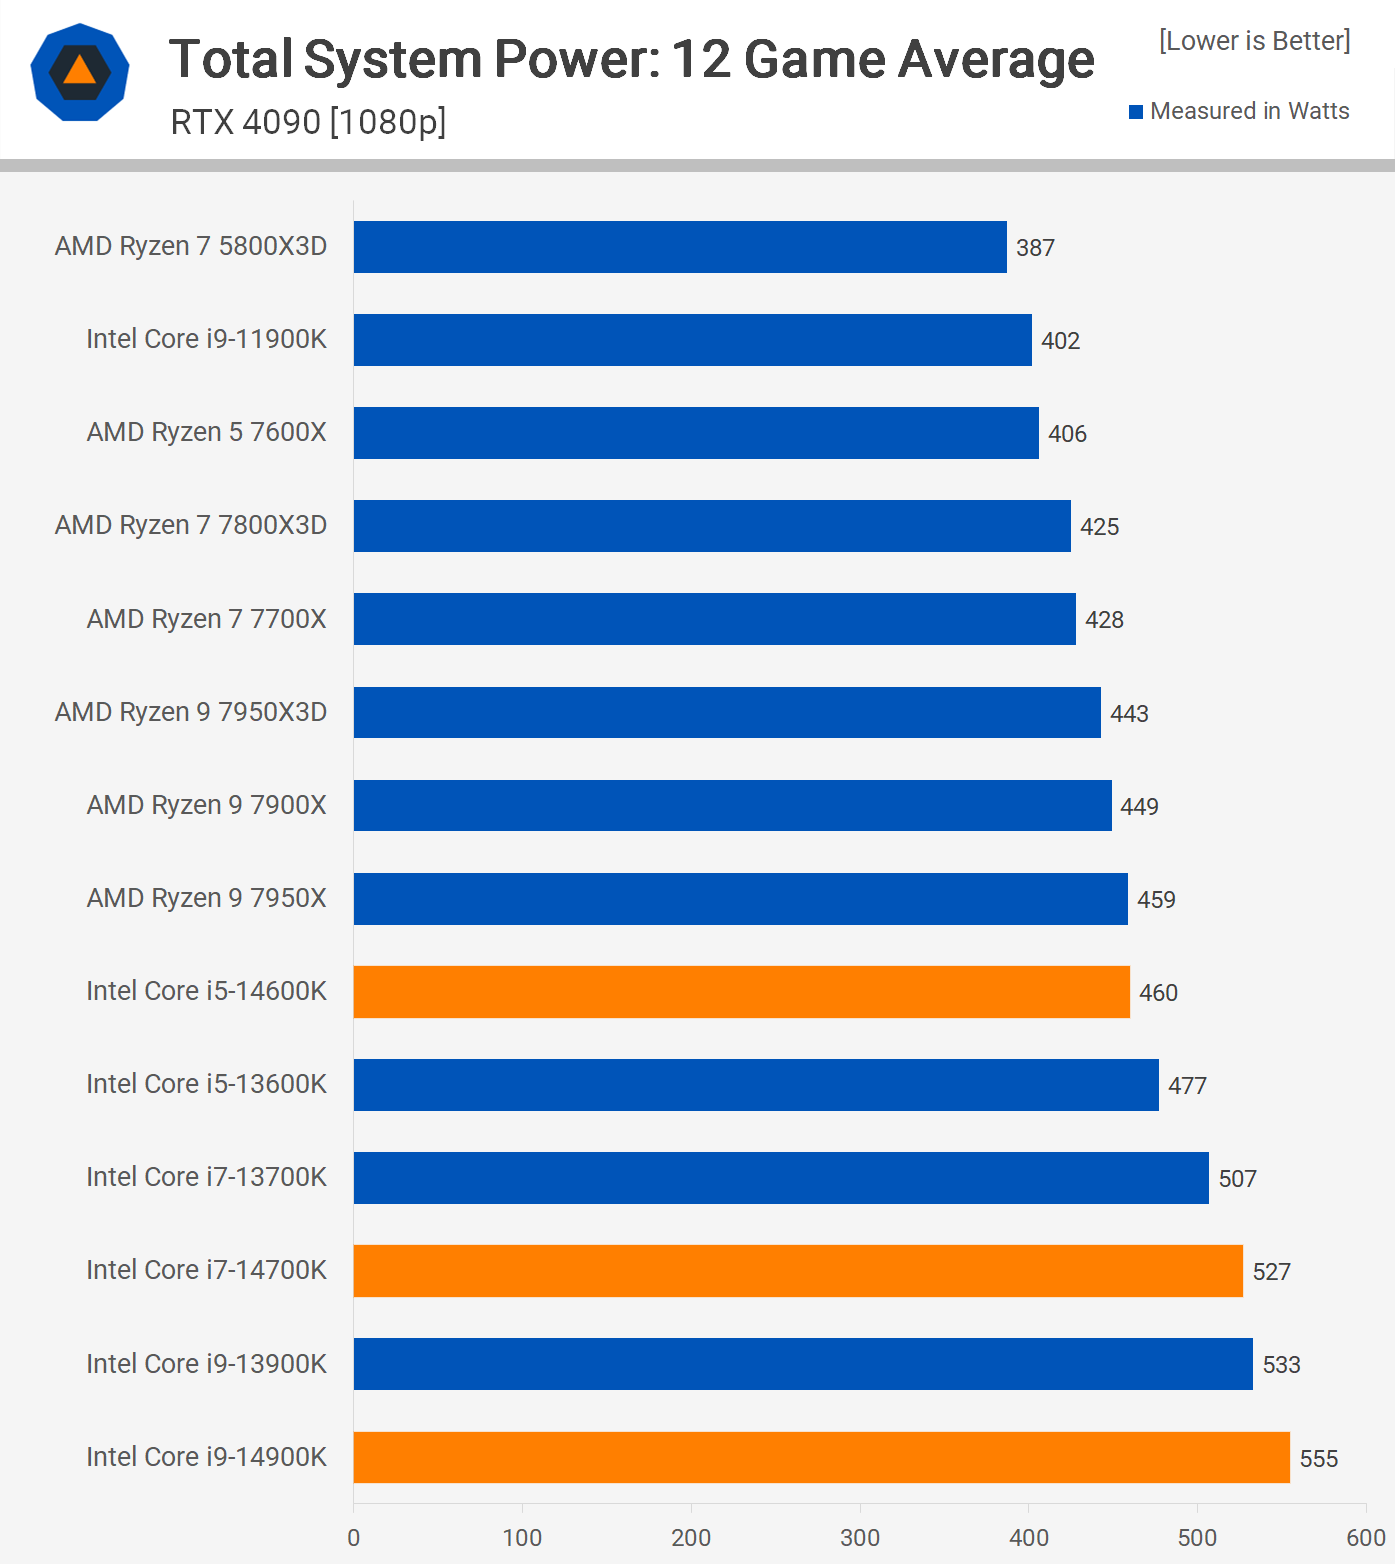
The Core i7 series has progressively lost its appeal, with the 14700K using about the same power as the 13900K during gaming sessions. While the 14600K isn’t too demanding, it still parallels the power consumption of the 7950X and 7950X3D.
Operating Temperatures
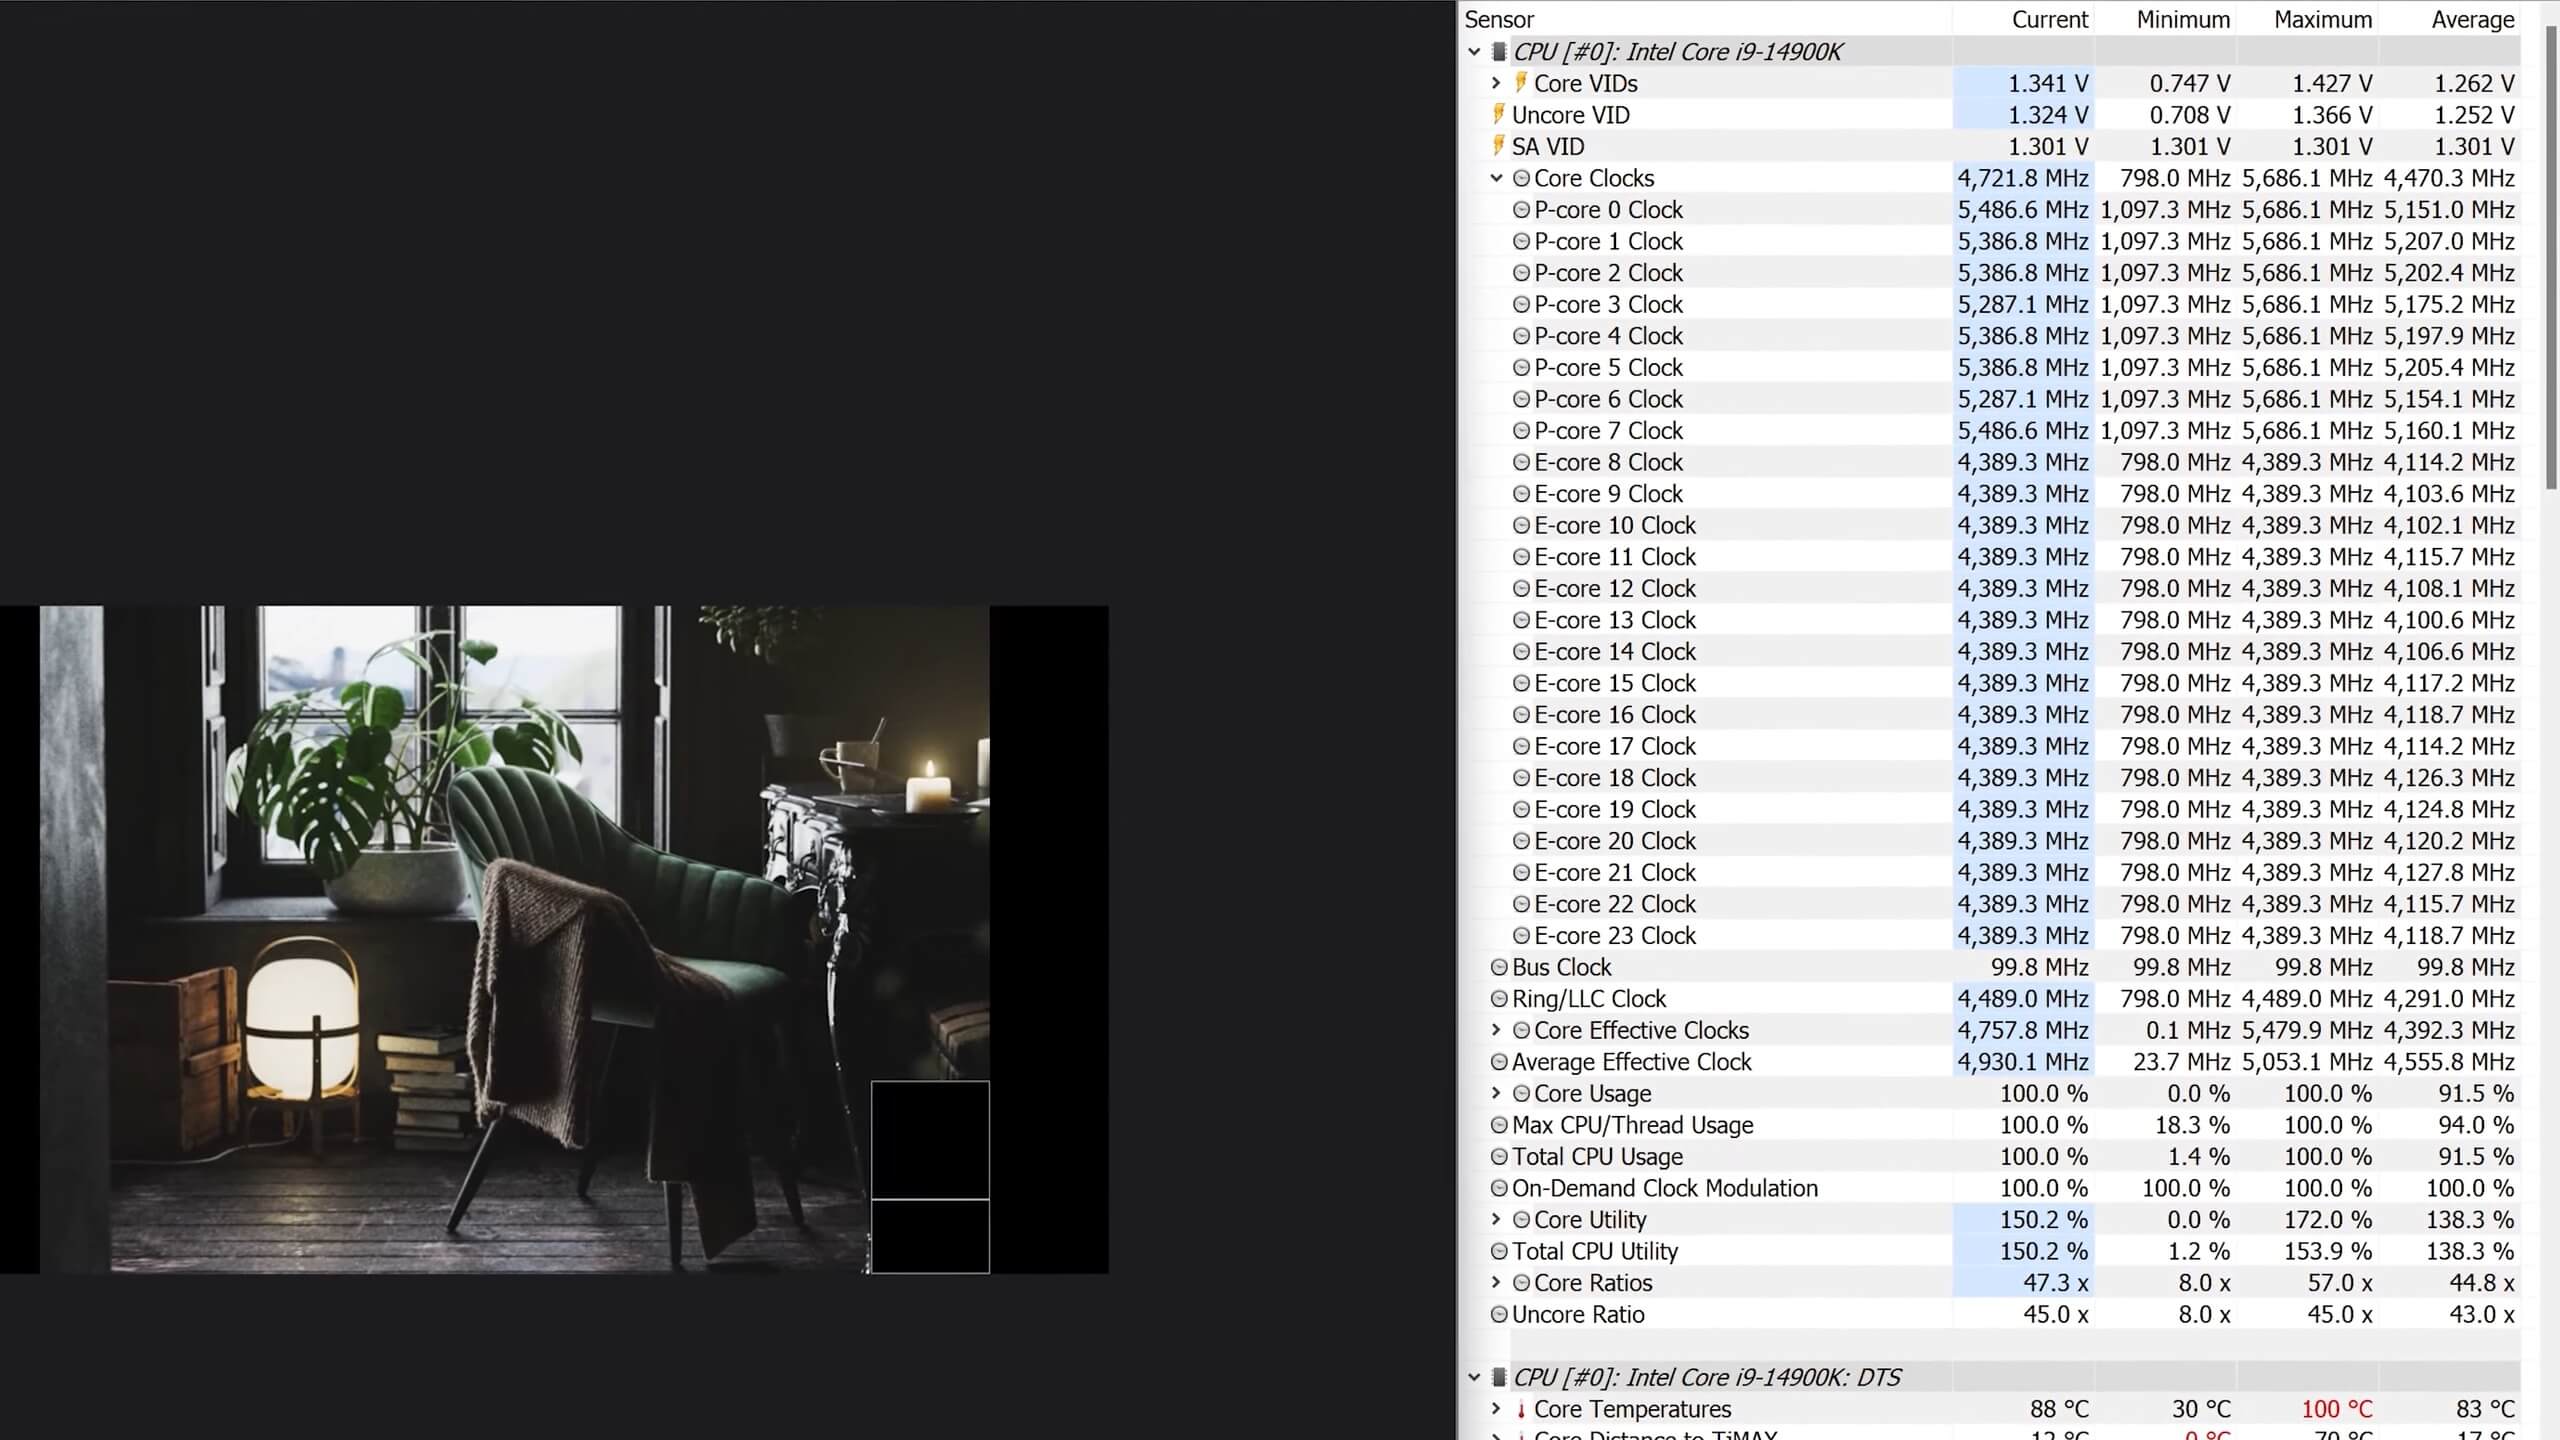
Given how power hungry these new 14th gen CPUs are, it’s hardly surprising that the Core i9-14900K reaches its TjMAX of 100°C almost immediately under an all-core workload, leading to throttling – even with the Arctic Liquid Freezer II 360 cooling it. After running for 30 minutes, we noted a total system consumption of 533 watts, with P-cores operating at 5.45 GHz and E-cores at 4.3 GHz.
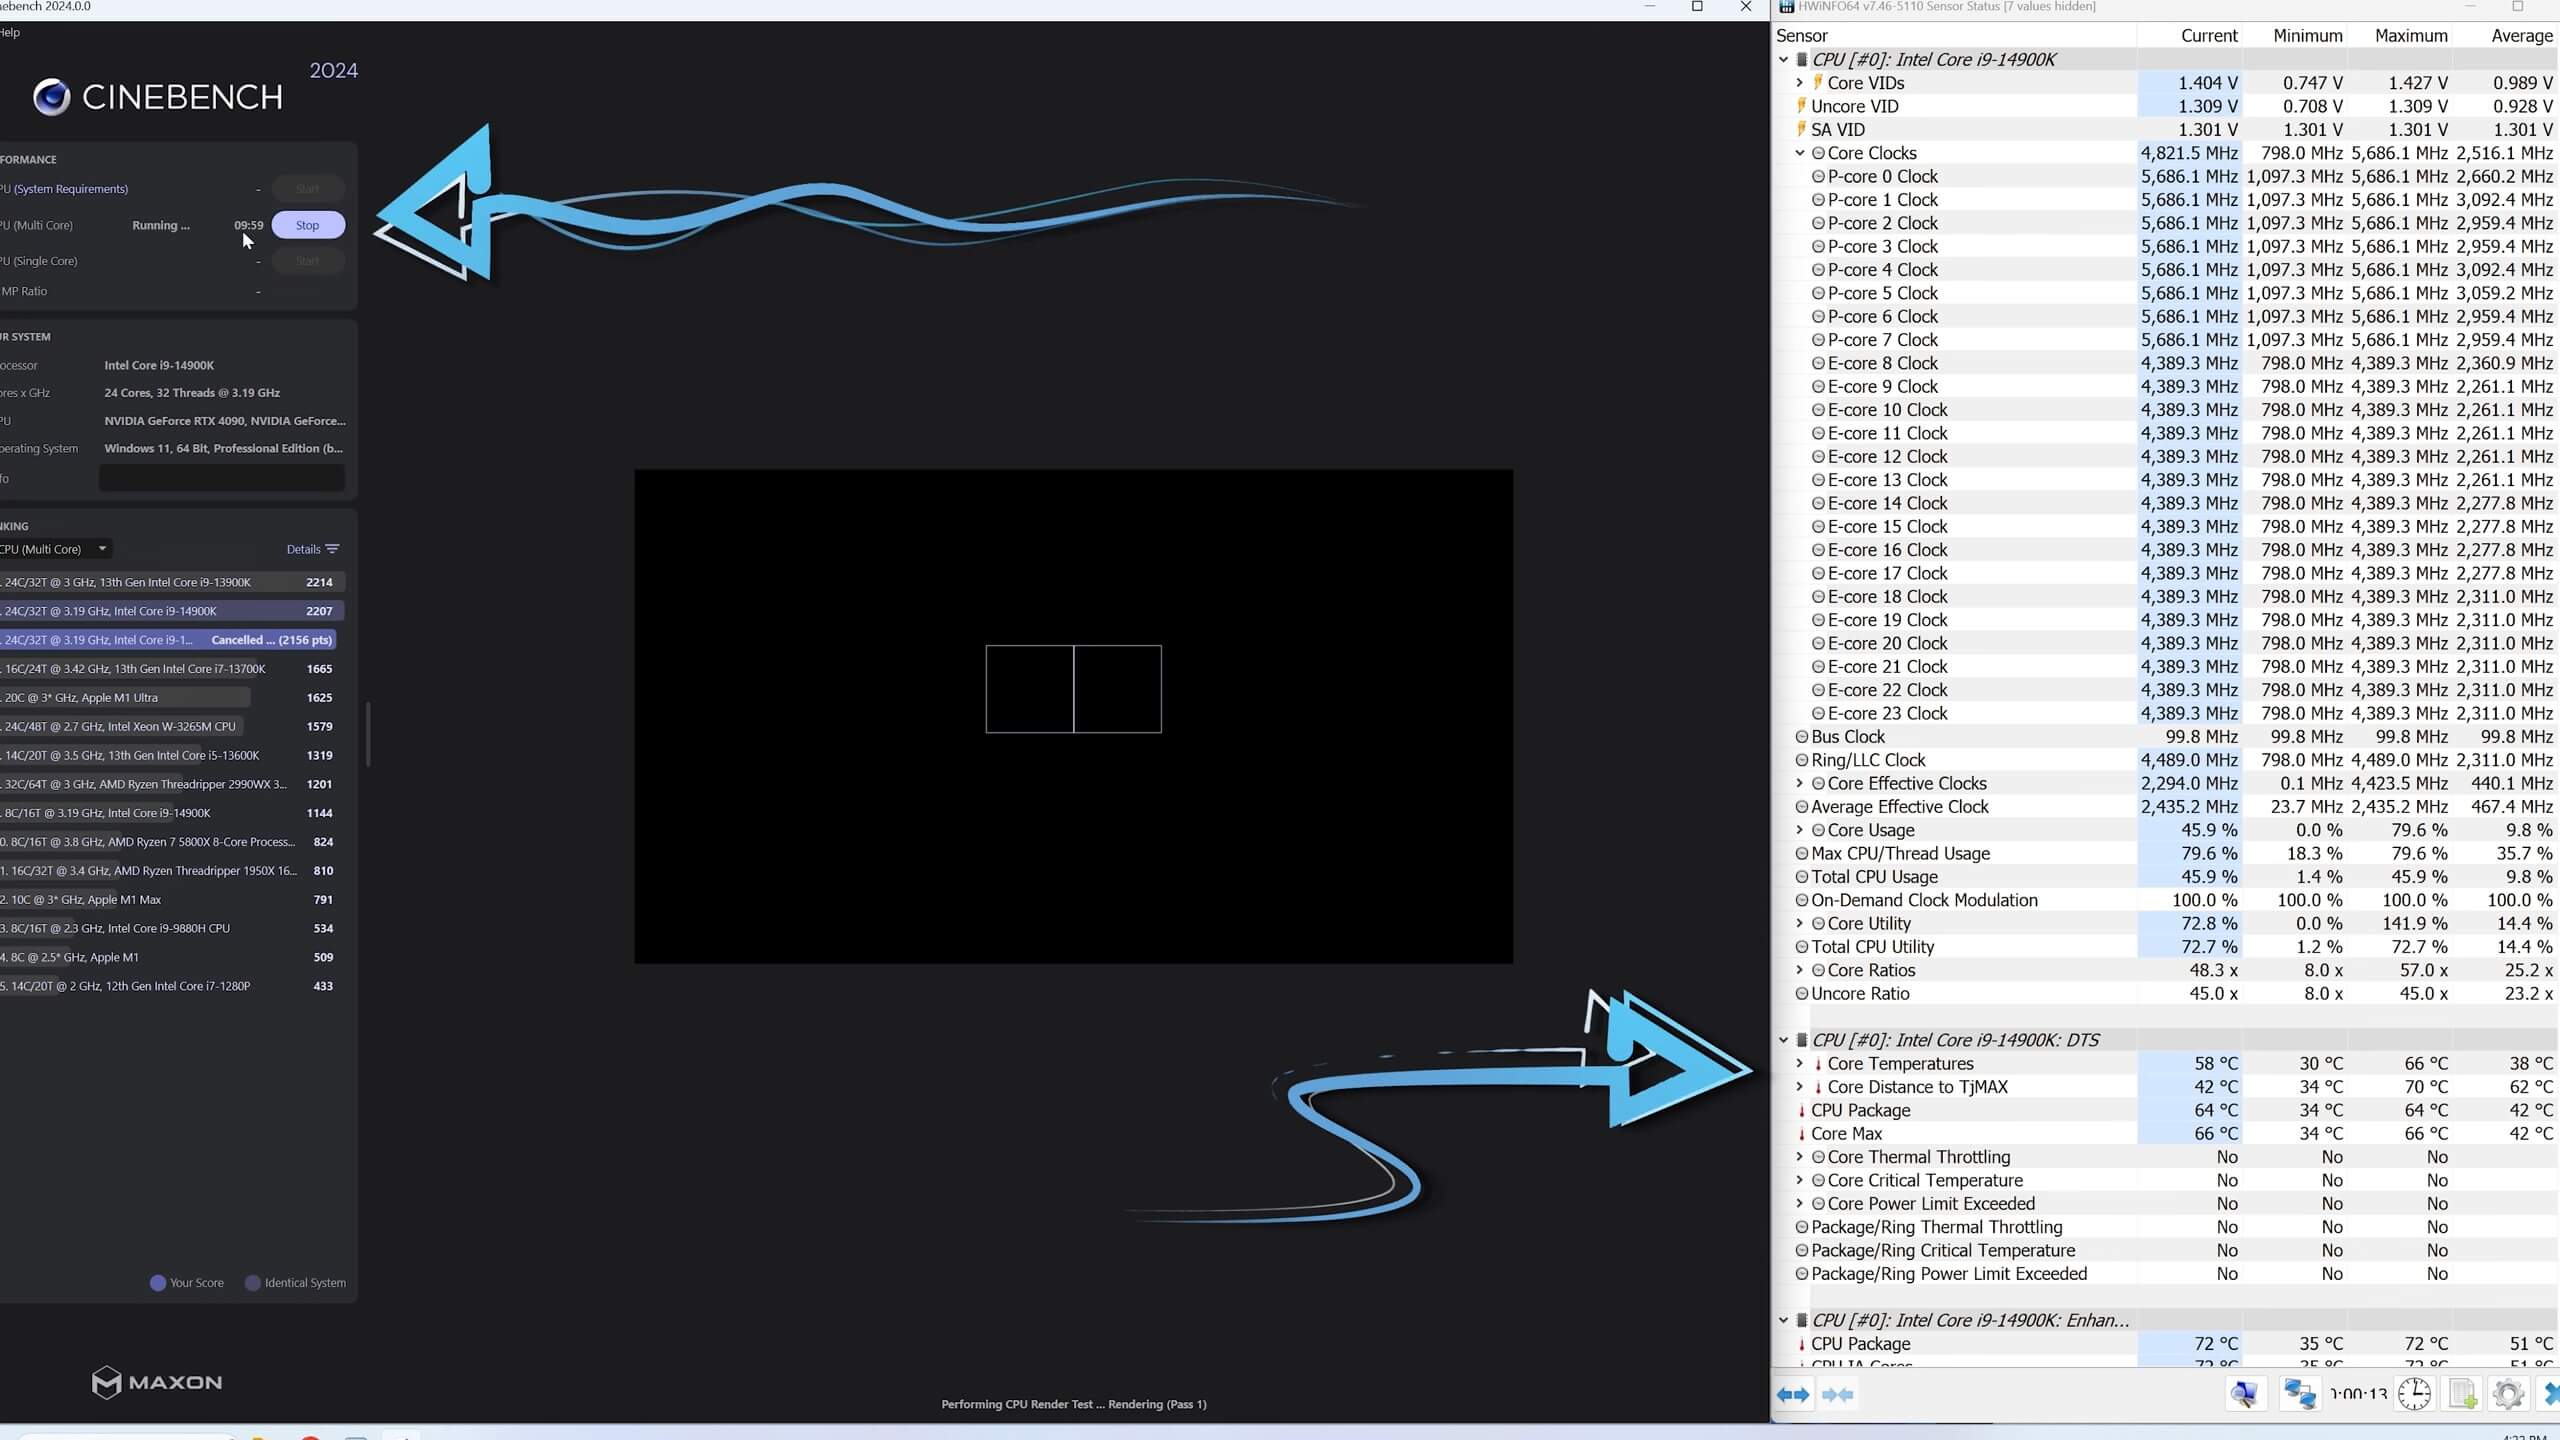
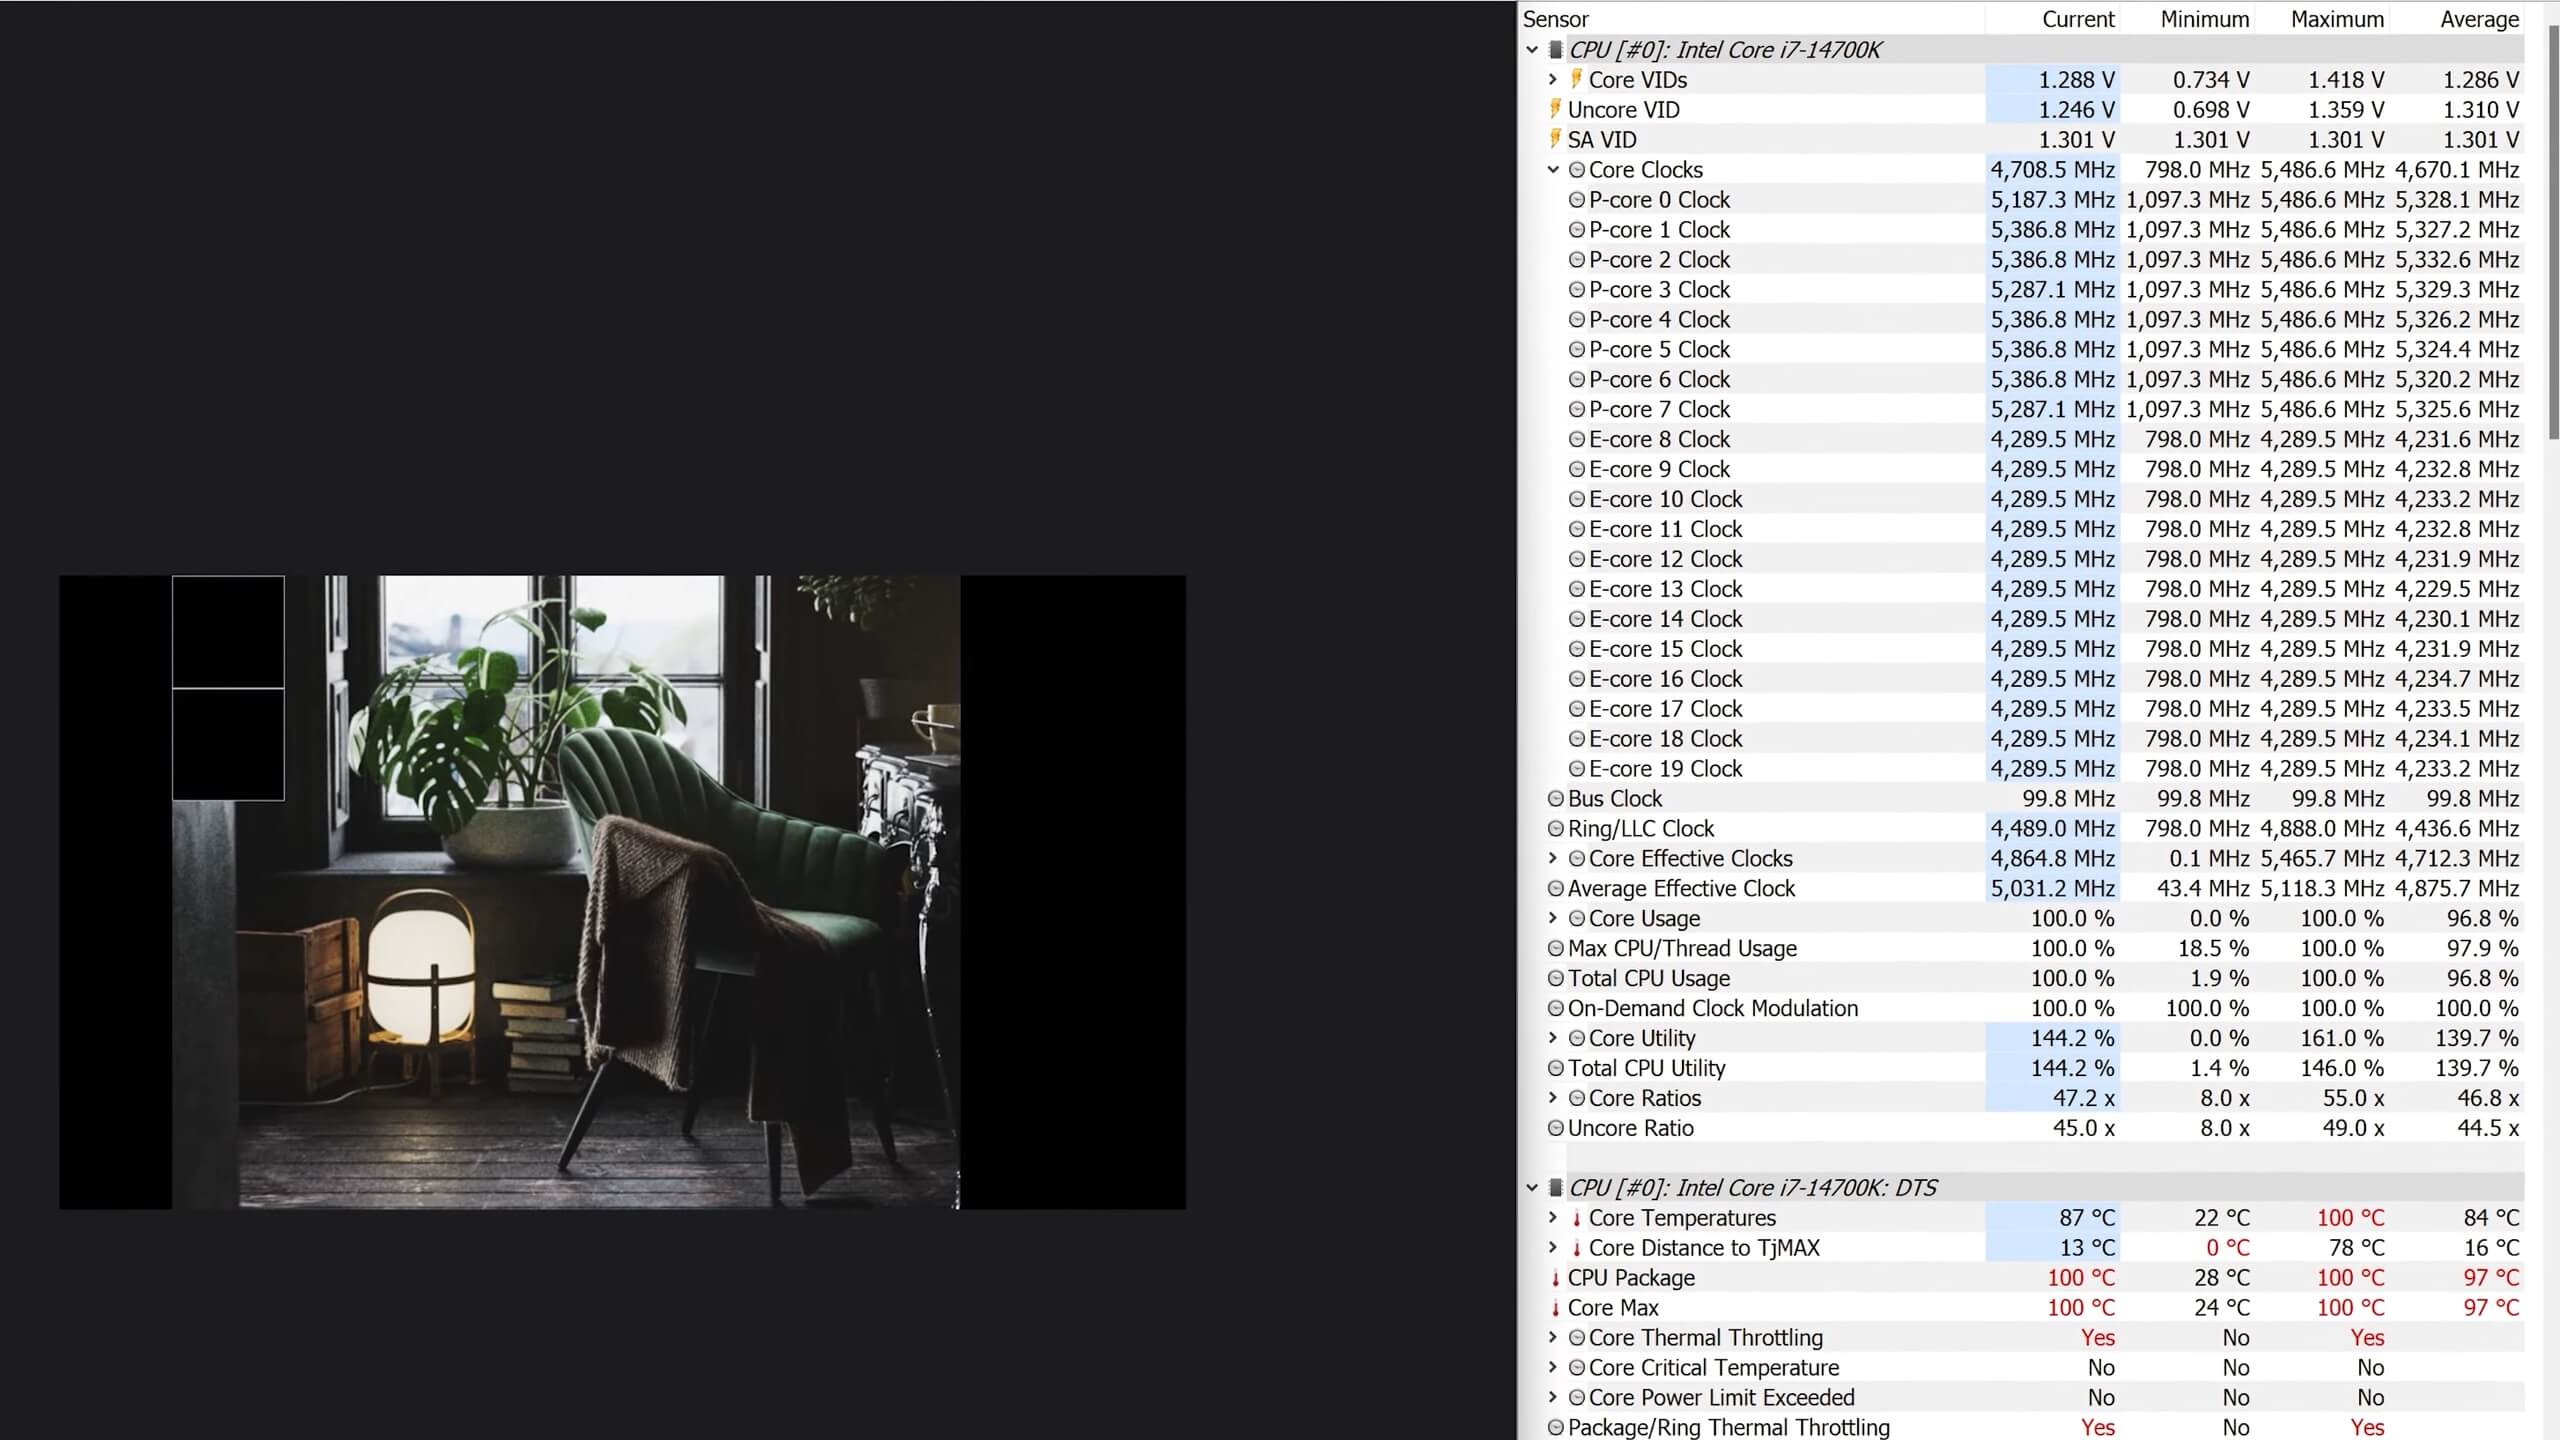
The Core i7-14700K followed closely, reaching a CPU package temperature of 100°C soon after initiating the Cinebench test. After half an hour, the average P-core speed was 5.35 GHz, and the E-core was 4.25 GHz, leading to a system consumption of 471 watts. This is 30% more than the 7950X and a staggering 70% more than the 7950X3D.
IPC Benchmarks
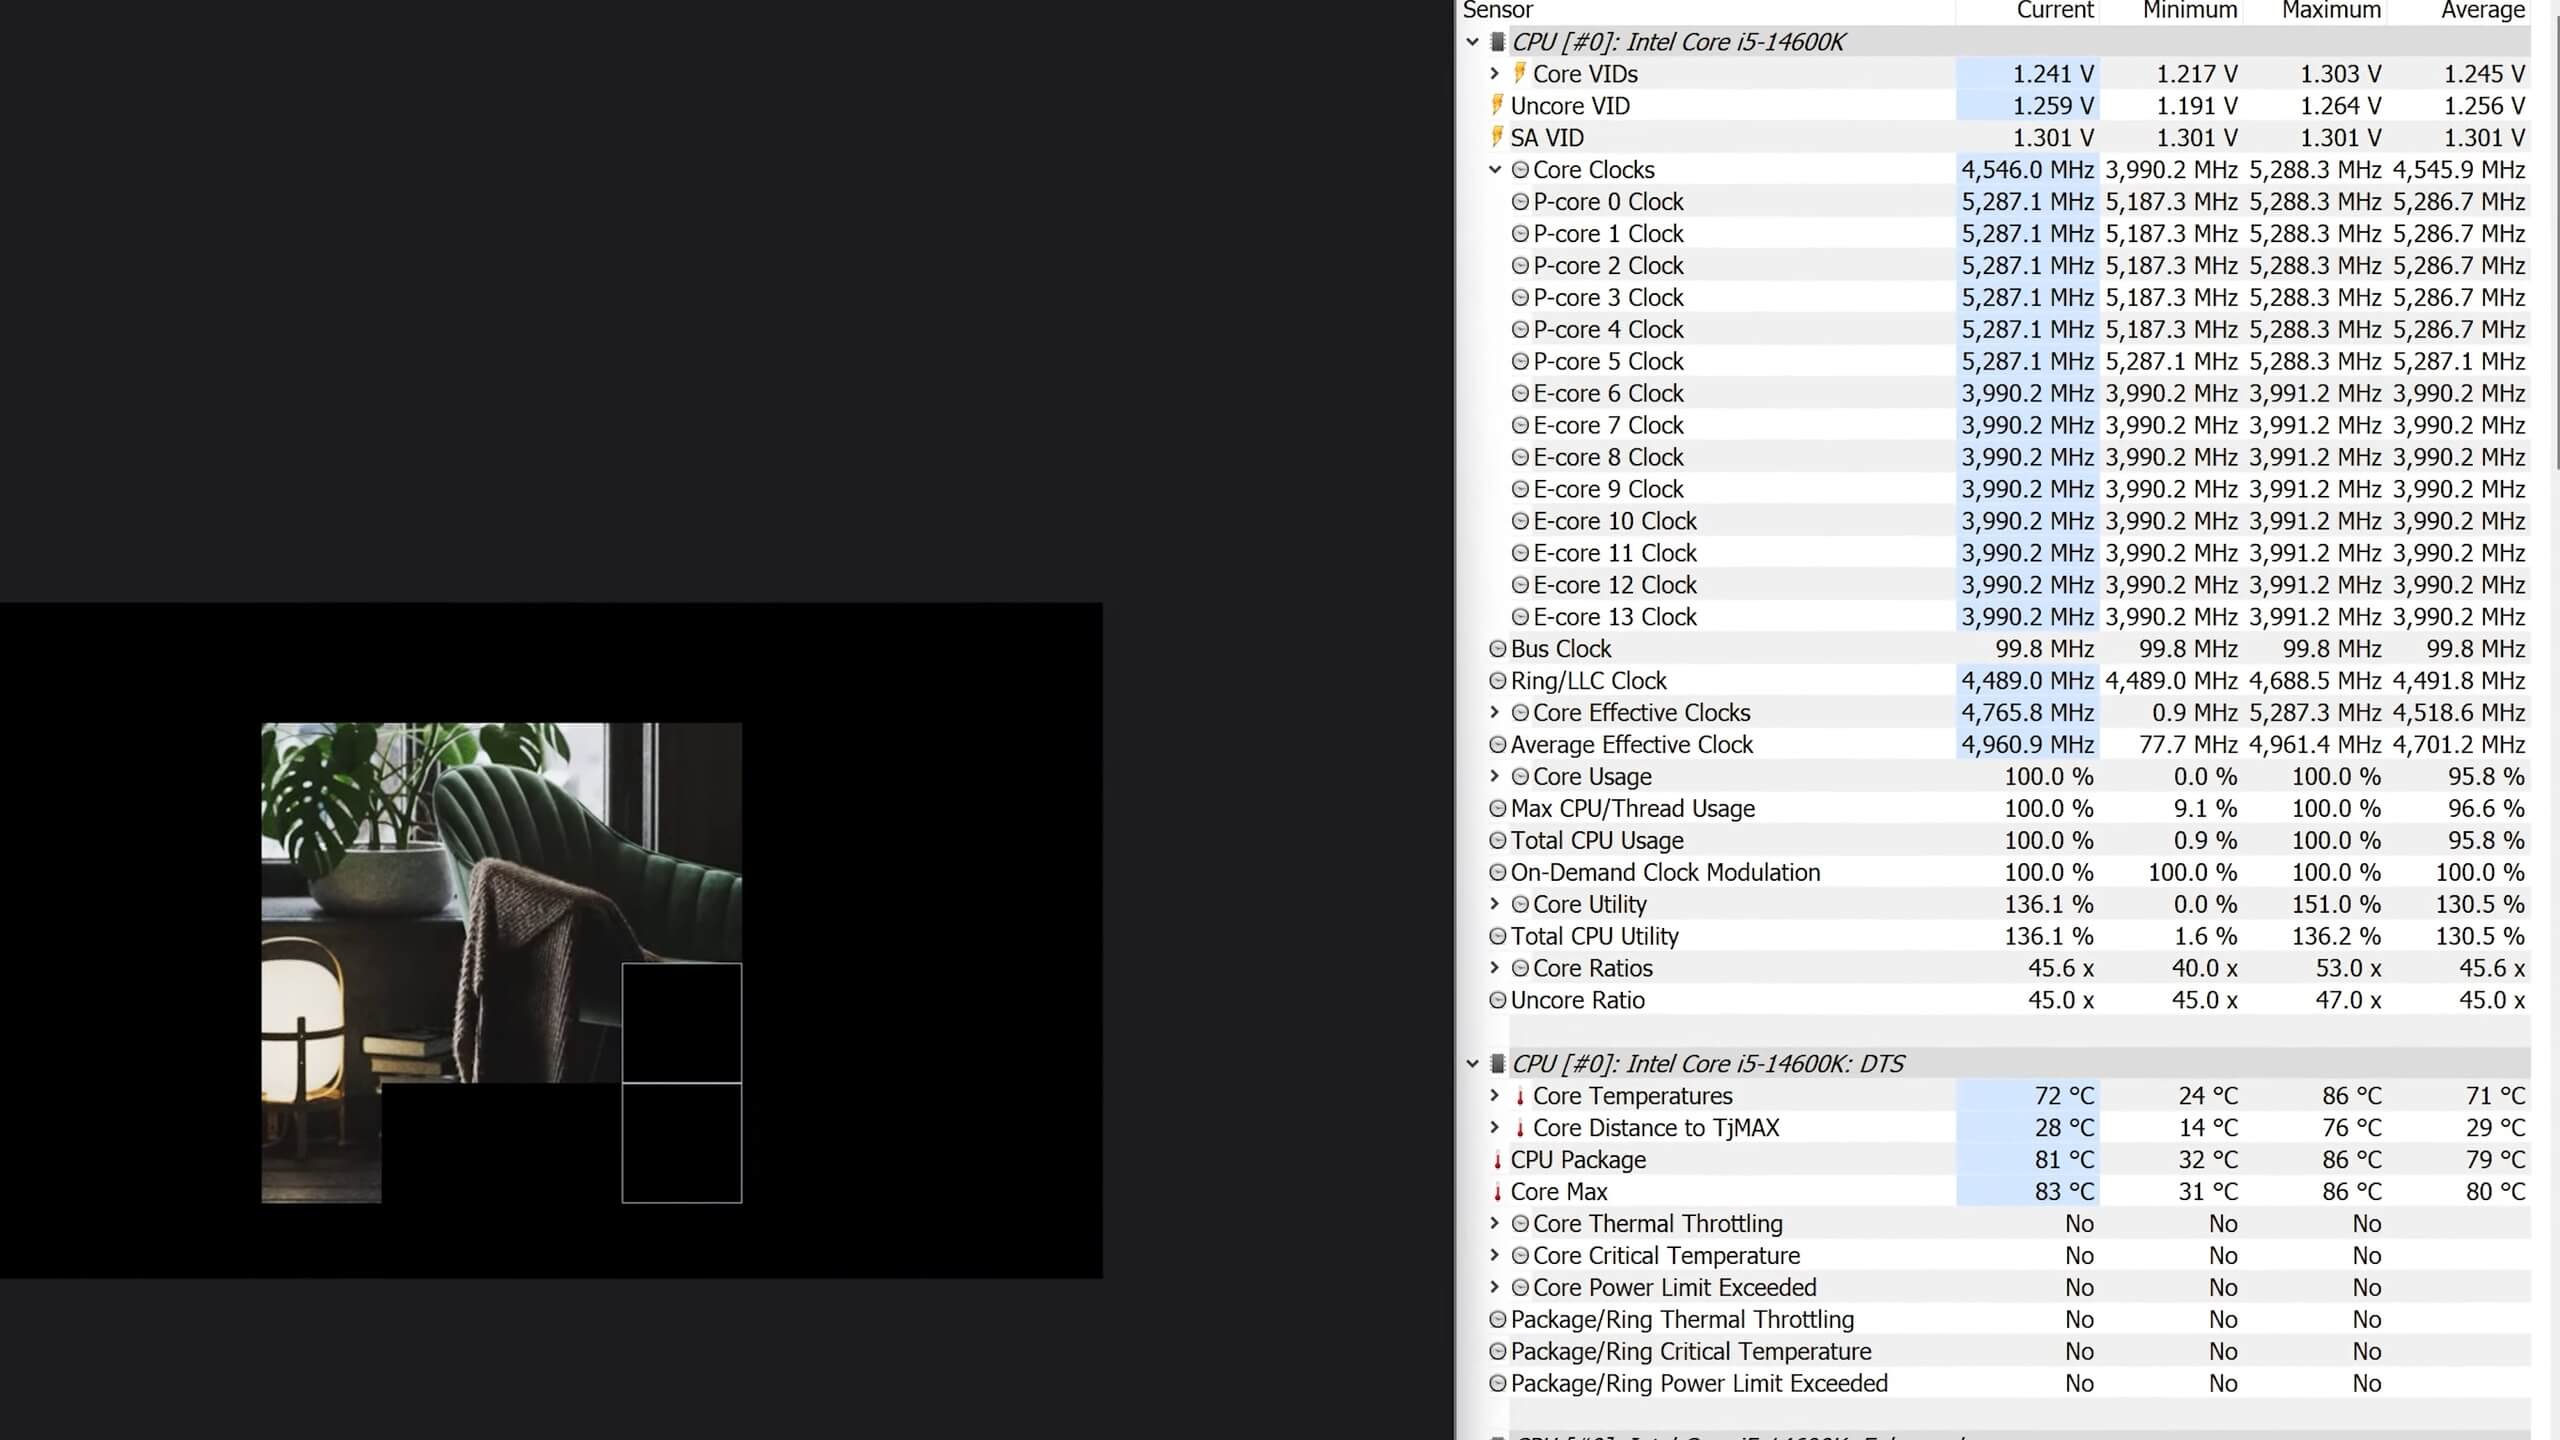
With the Core i5-14600K, the maximum package temperature observed was 86°C, 14°C shy of TjMAX. Such a result would have been appreciated in the i9. This allowed the i5 to maintain an average of 5.3 GHz on the P-Core and 4 GHz on the E-Cores, resulting in an average system usage of 310 watts.
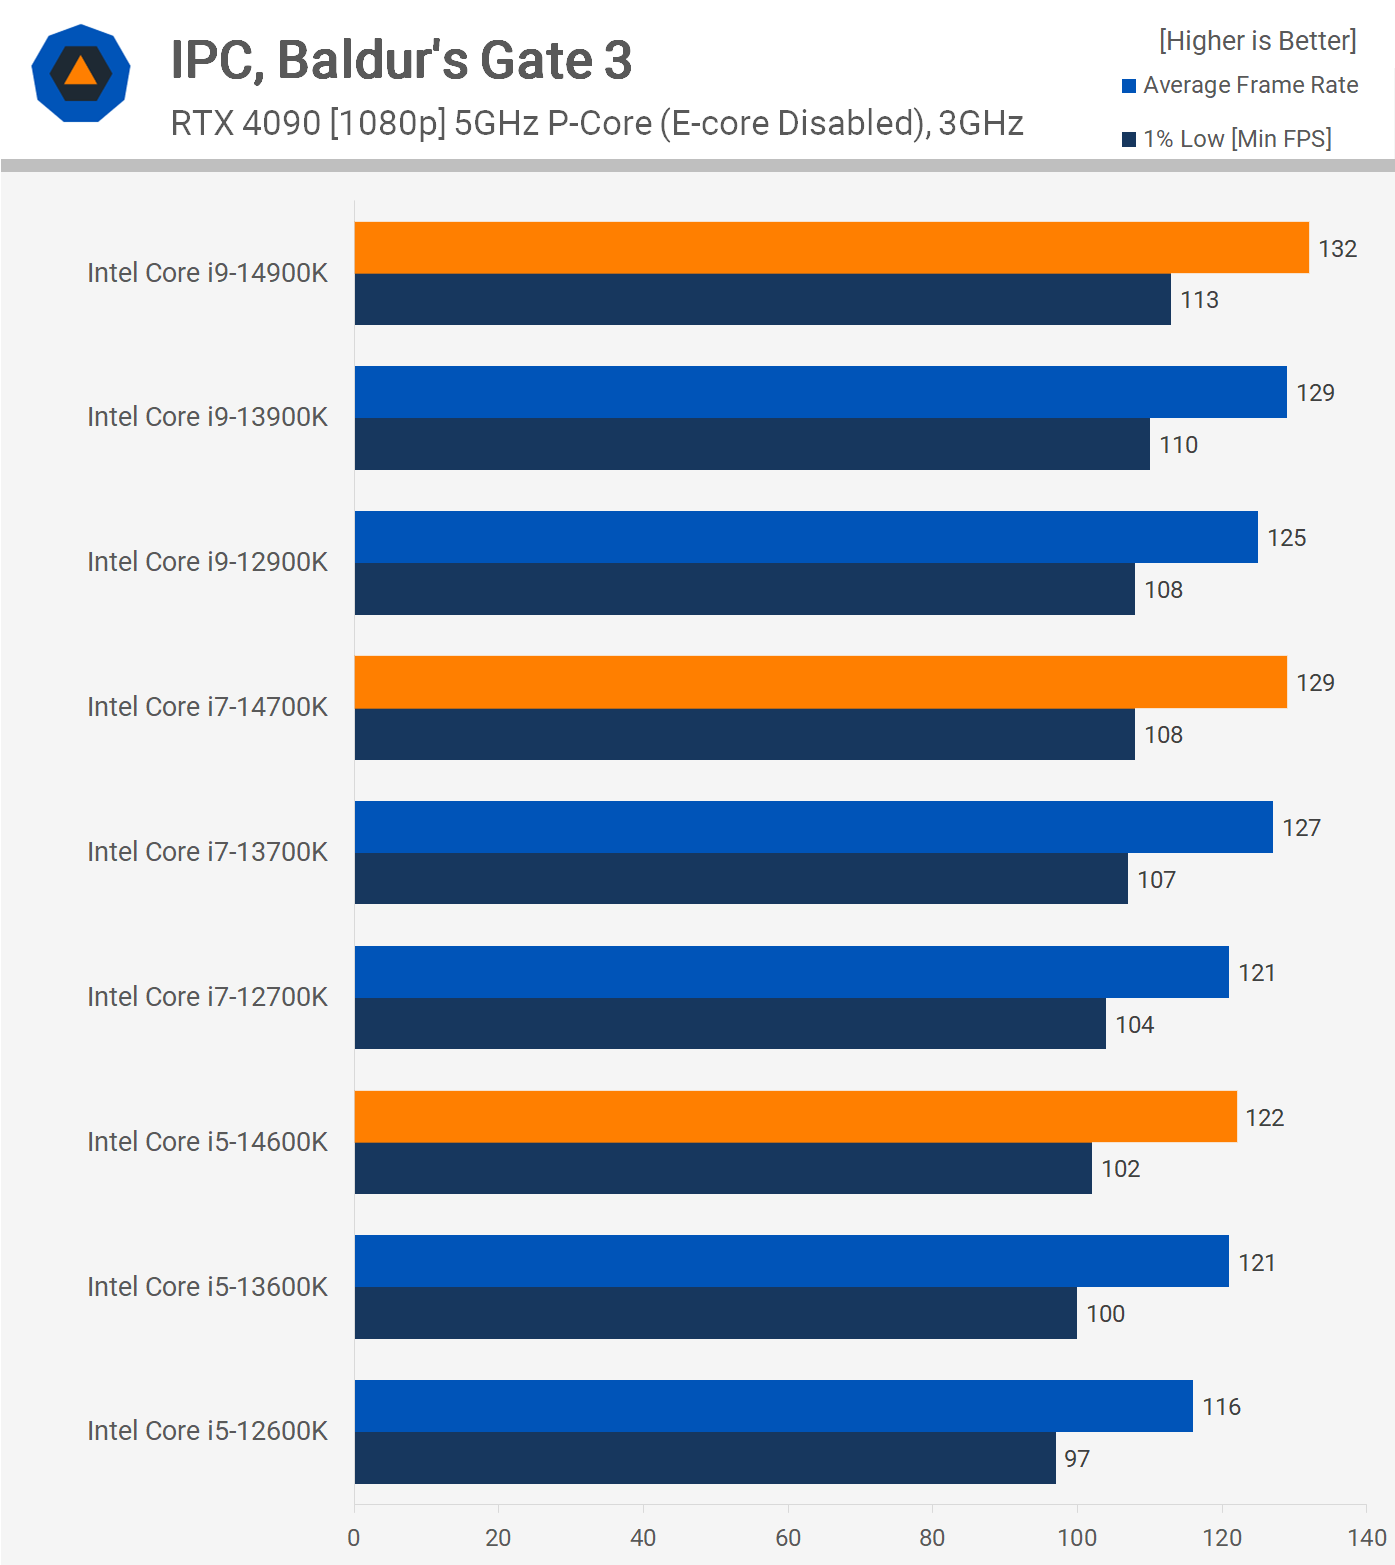
Before concluding our tests, let’s glance at some IPC results. By running Baldur’s Gate 3 with all processors at 5GHz (with a 3GHz ring bus and E-cores disabled), we observed that the 14900K is roughly 2% swifter than the 13900K, which is 3% faster than the 12900K. From the 12900K to the 14900K, there’s a slight 6% increase in IPC.
For the 14700K, we noted a 7% speed increase over the 12700K and just 2% over the 13700K. The 13600K showed a 4% improvement over the 12600K, but a mere 1% for the 14600K when compared to the 13600K. These are subtle IPC enhancements for this game.
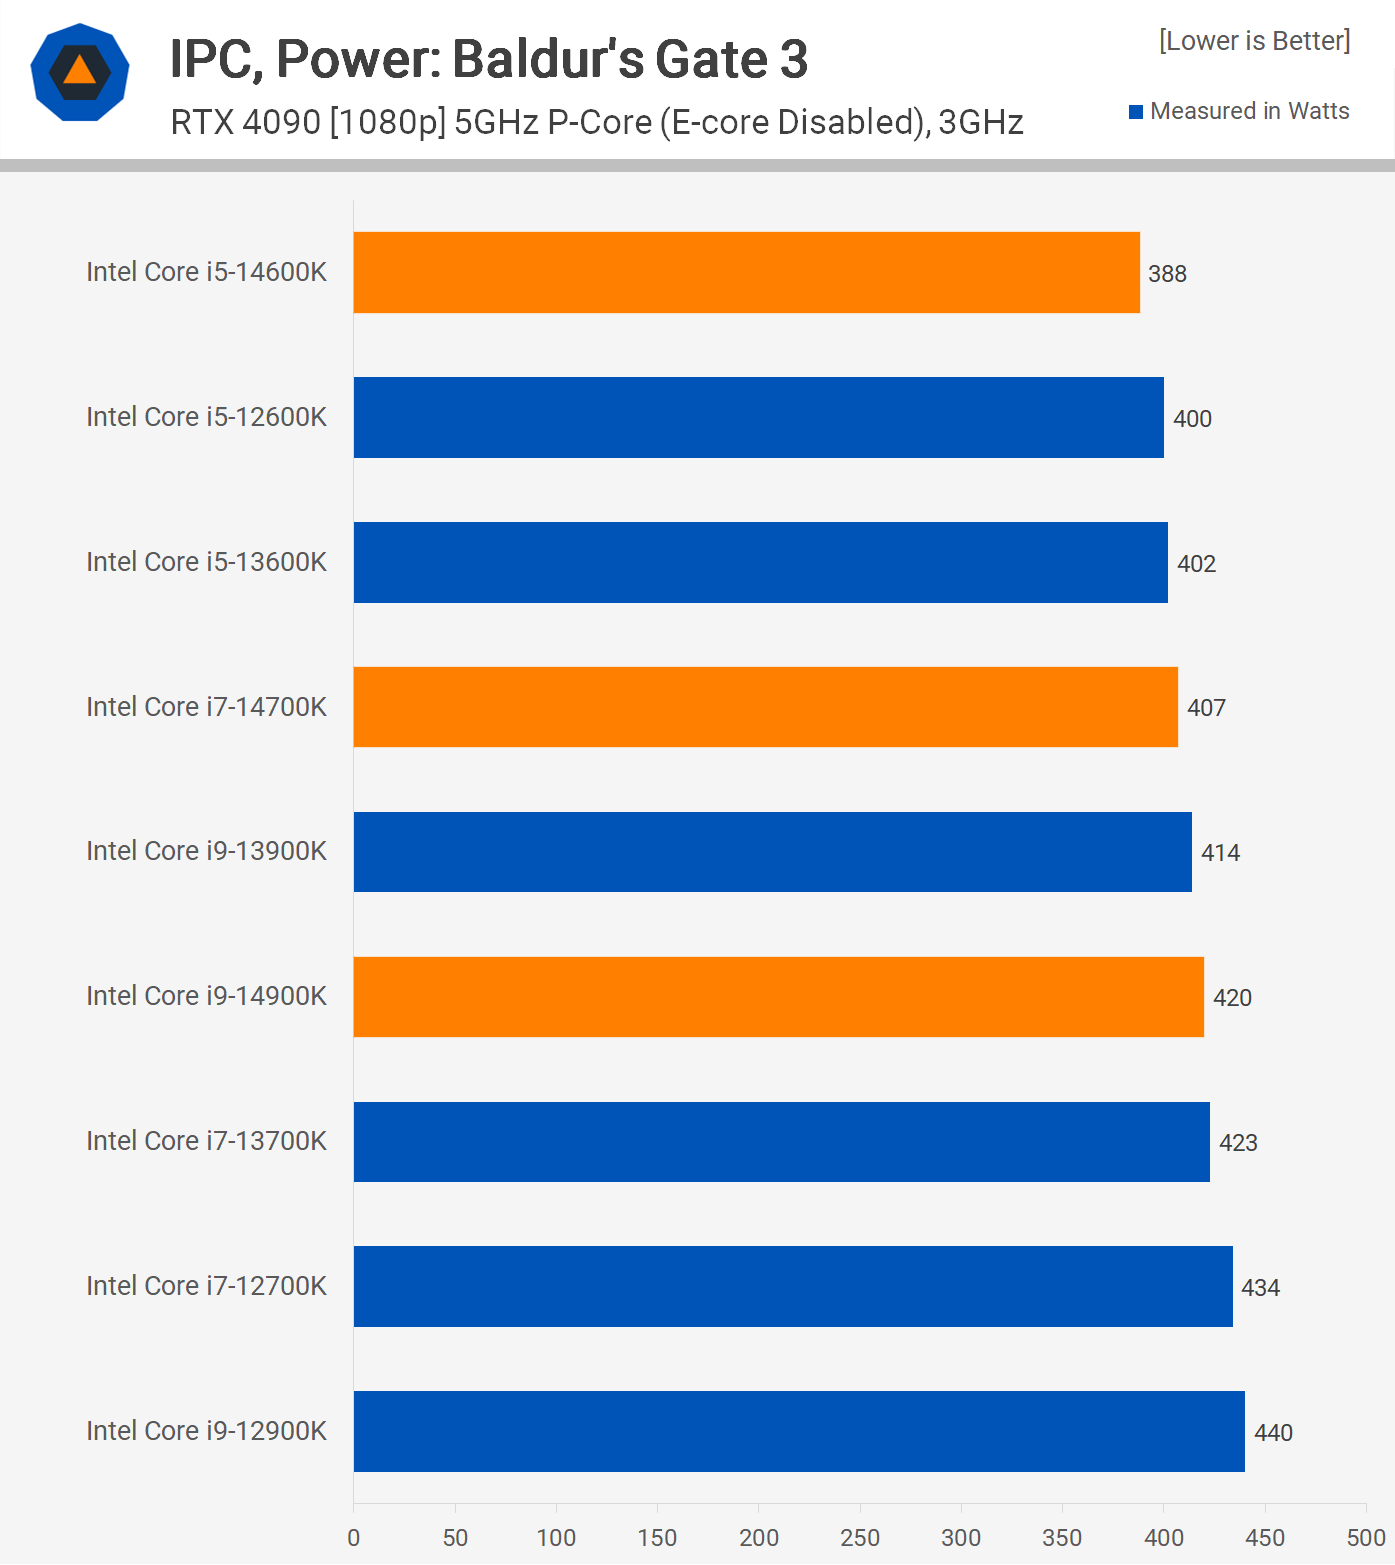
While power consumption seems to have improved since the 12th gen, our tests did not fix the voltage. Instead, the motherboard managed it. There’s a chance the 12900K required more power. Hence, this data should be approached with caution; it’s presented primarily for informational purposes.
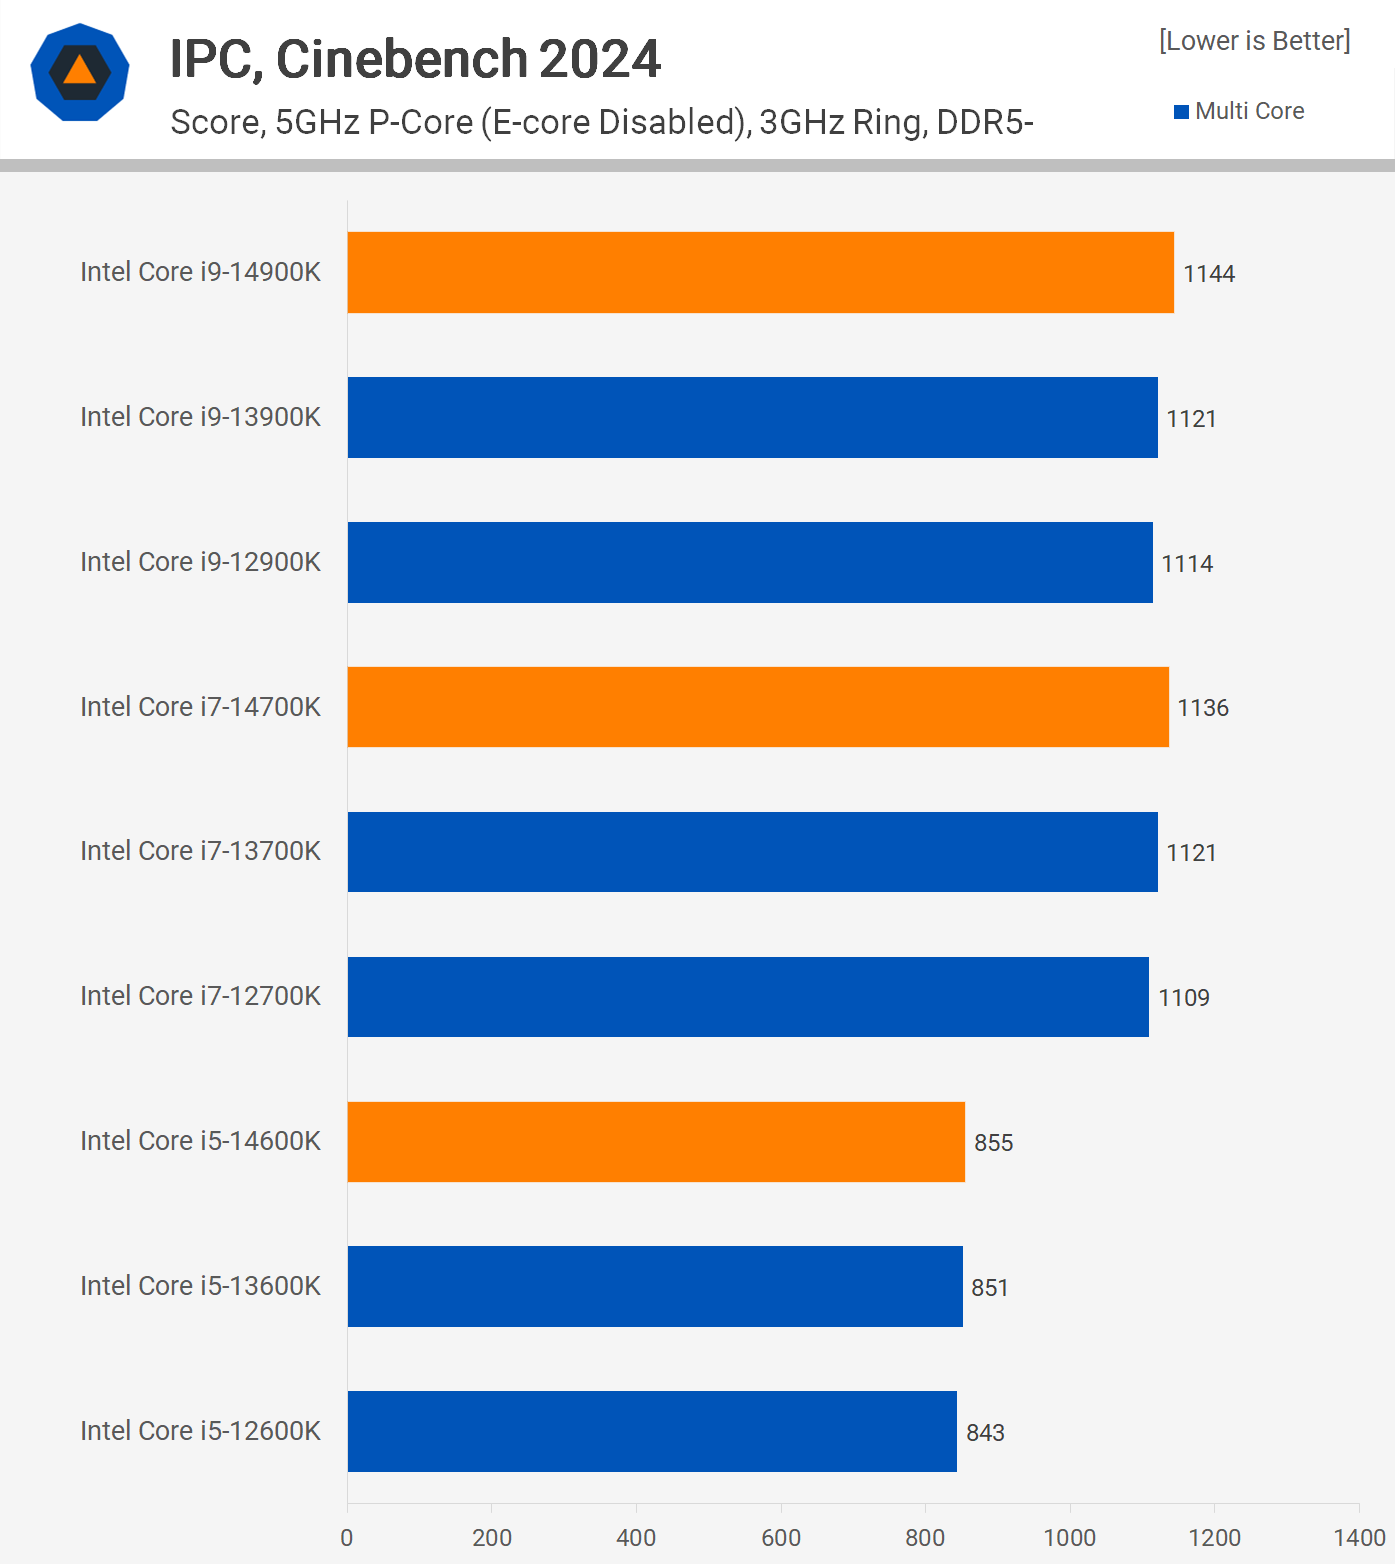
Baldur’s Gate 3’s improvements appear impressive when juxtaposed with the results from the Cinebench multi-core test. The 14900K was only 2% faster than the 13900K and 3% speedier than the 12900K. The 14700K edged out the 13700K by 1%, and the difference between the 14600K and 13600K was a mere half-percent.
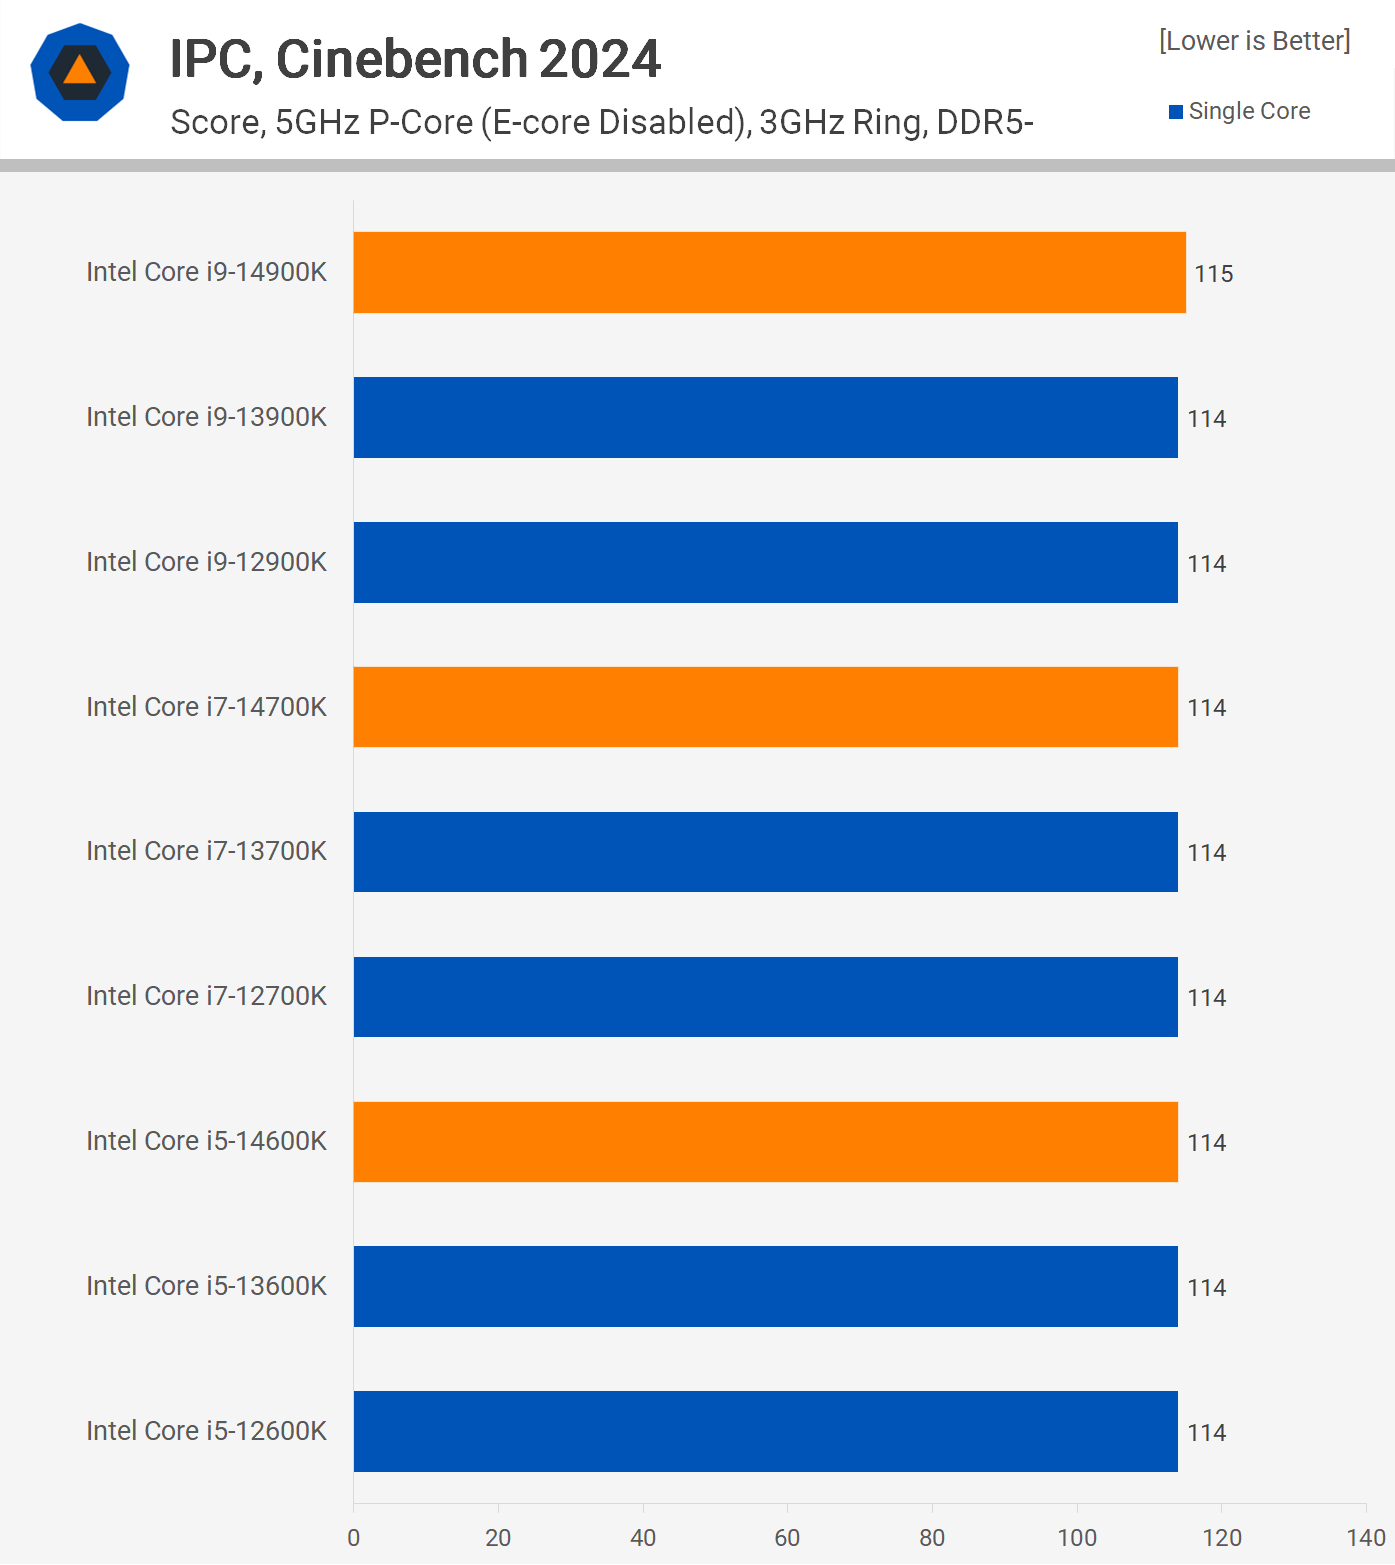
In the single-core results, the growth was even less evident. While it might be tempting to claim this is Intel’s typical performance trajectory, it has only been a couple of years, so such a statement would be premature.
What We Learned
The Raptor Lake Refresh is pretty much just that, a refresh, and the newly released chips certainly don’t deserve to be called a 14th generation. Apart from the 14700K which gets a few extra E-cores, this is a simple rebranding with some software optimizations for games.
In short, this was a big time waster, so thanks for that Intel. But at least we got to update all of our data and include a range of new games. Realistically though, we’d rather Intel just waited until they actually had a 14th generation to release, rather than rehash what they were already selling.
Now you might be wondering, what’s the point? Why did Intel even bother? The reason is marketing people. For the most part, 13th-gen sales haven’t been great, particularly for the retail market. OEM is likely a different story as Intel is still the dominant player, but even so sales have also likely slowed down there.
As a showcase of the retail market we have the Amazon Best Sellers list for CPUs, which is updated every hour. You can see the screenshot below from this week, but it almost always looks like this and has for years now. What we’re seeing there is AMD CPUs dominating the top 10, taking over 7 out of the top 10 places.

So rather than heavily discount the 13th-gen parts, allowing them to better compete with the Ryzen 7000 series, Intel has opted to disguise those parts as a flashy new 14th generation in the hope that this will boost interest in their desktop processors.
Speaking of pricing, the Core i9-14900K is set to come in around $600, about the same price as the 13900K which can be had for $570. That’s a rough price point for Intel given the 7950X3D is $650 right now, while the 7800X3D can be had for just $370, making it by far the best value option for gamers.
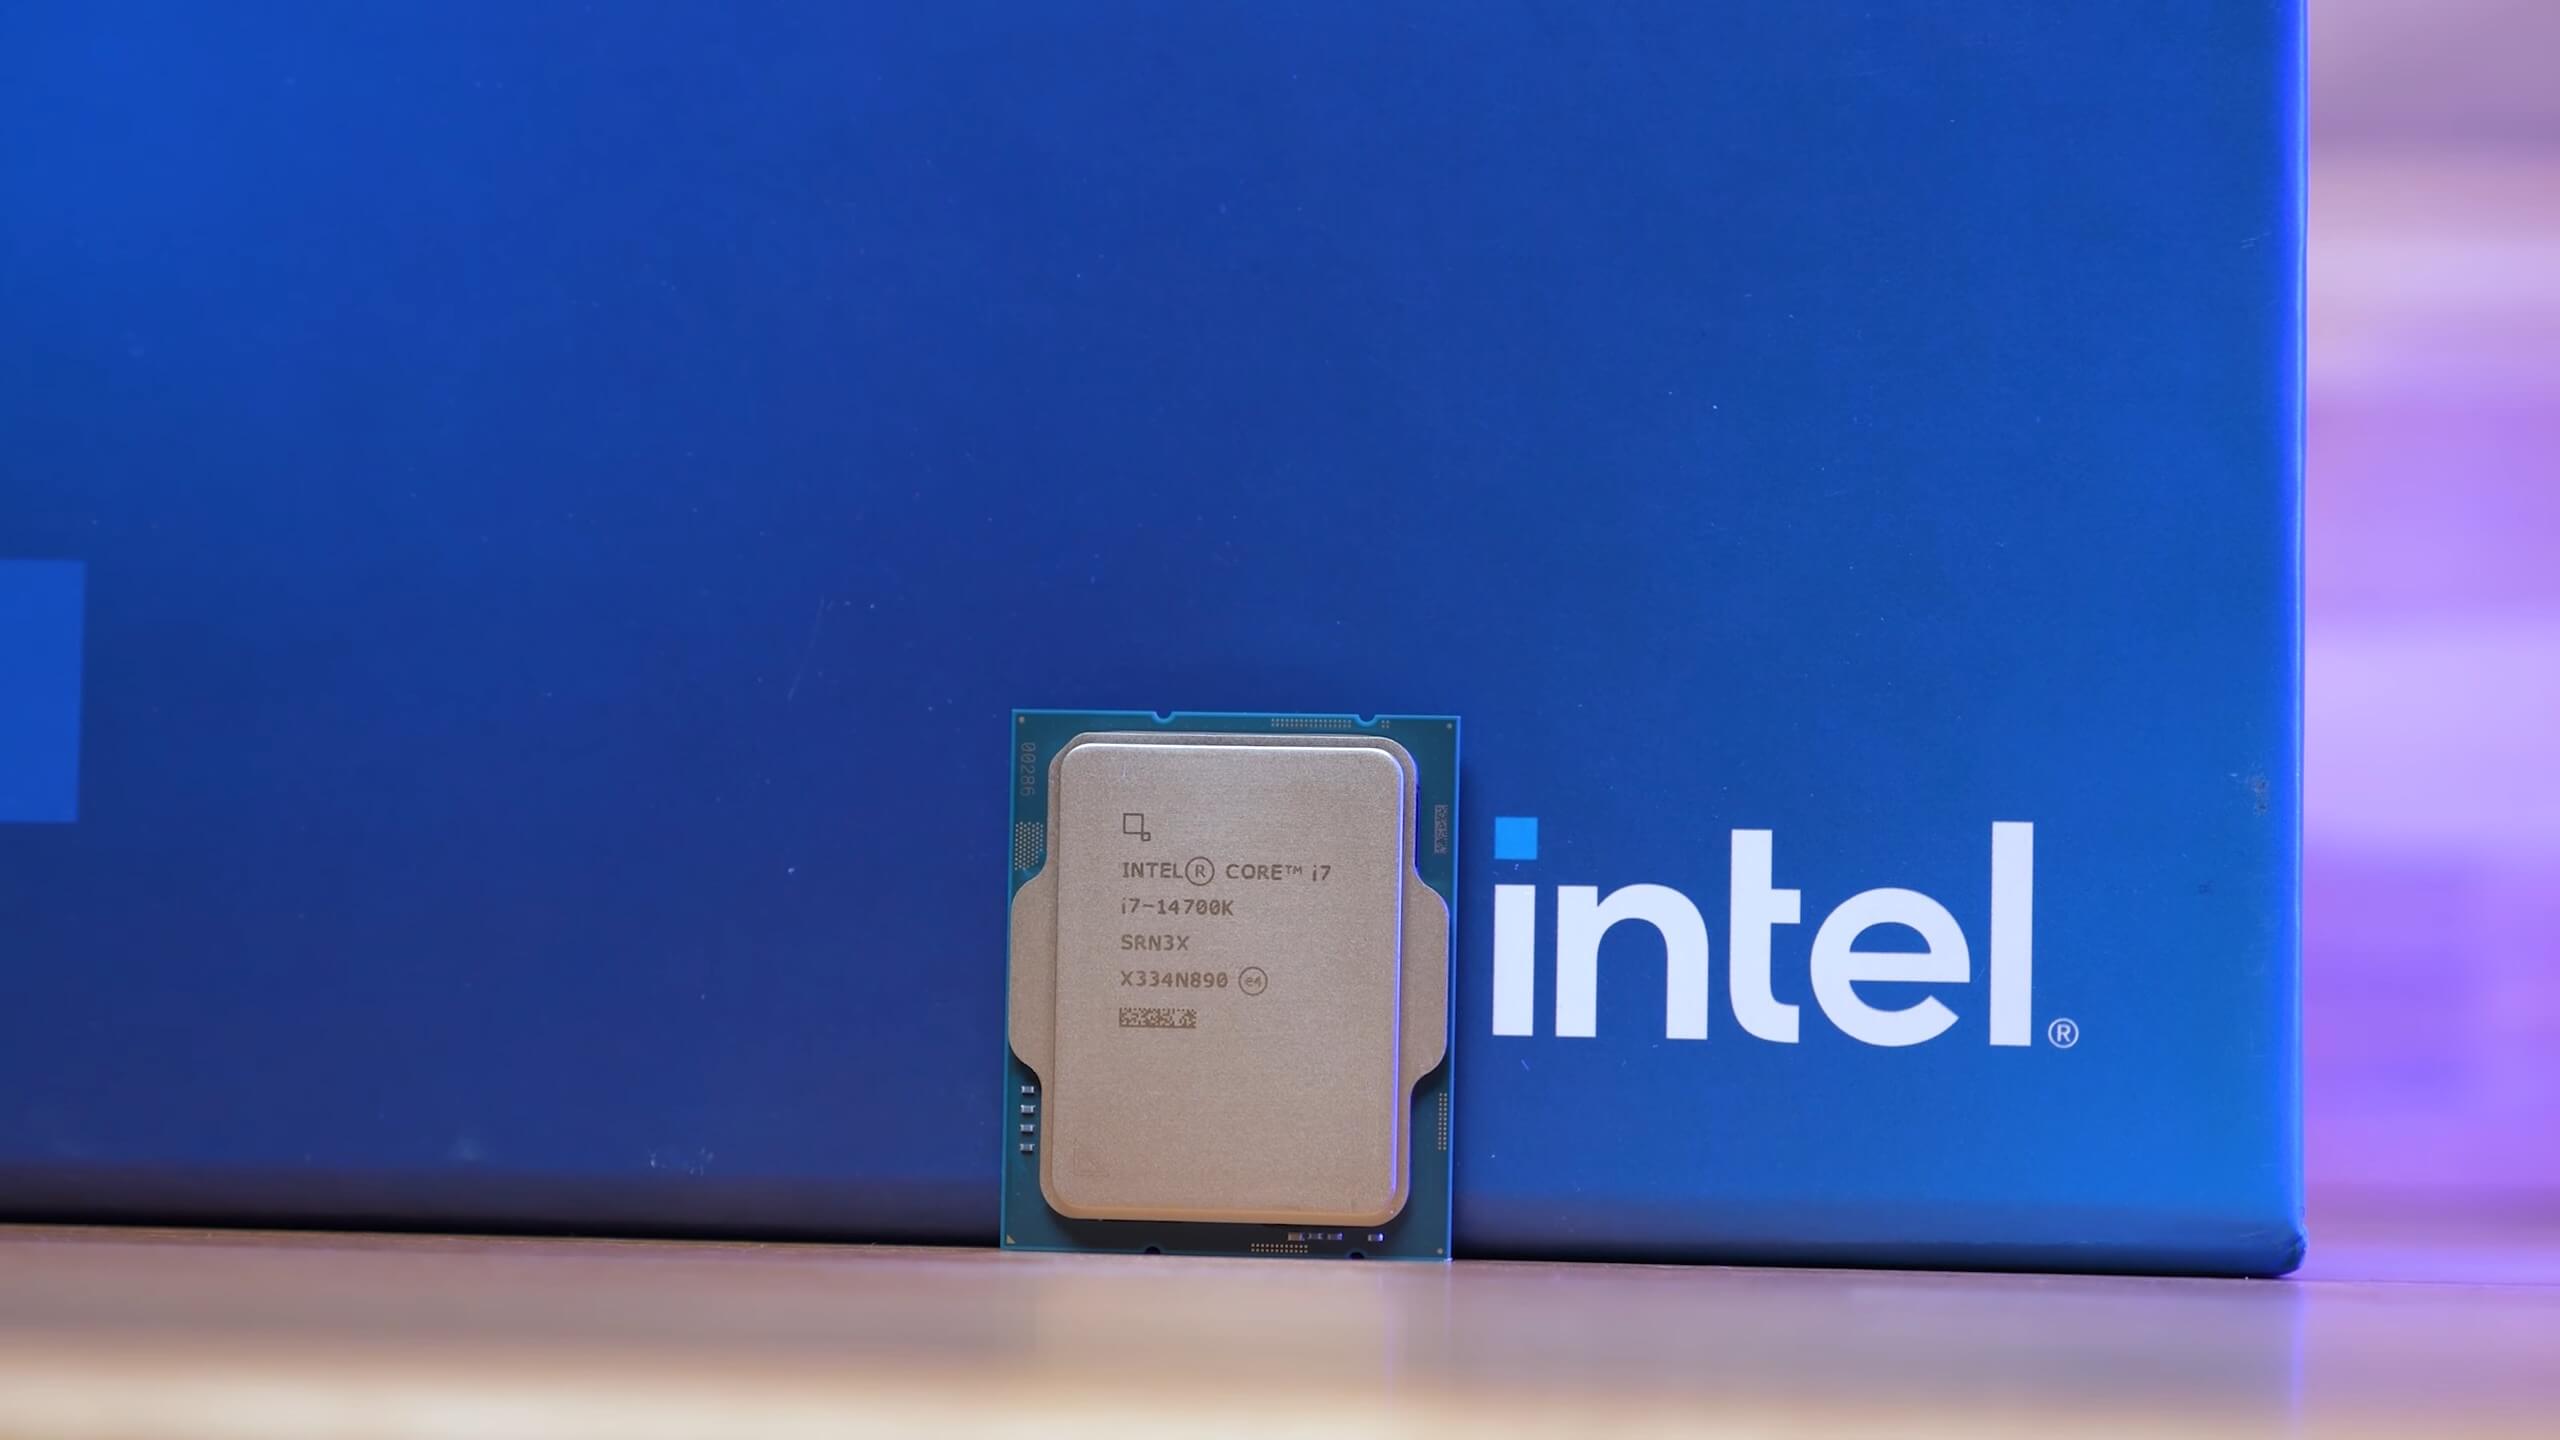
Then if it’s productivity you’re interested in, the 7950X is hard to beat at $580 as 16 big cores if you will, often end up being faster for complex workloads.
The i7-14700K is a nice upgrade over the 13700K at what should be the same MSRP, though while the 13th-gen i7 is meant to cost around $420, it can be reliably found down around $365 right now. So if the 14700K jumps in at $420 it will be competing directly with the 7900X and that’s a match up that suits the Intel processor rather well.
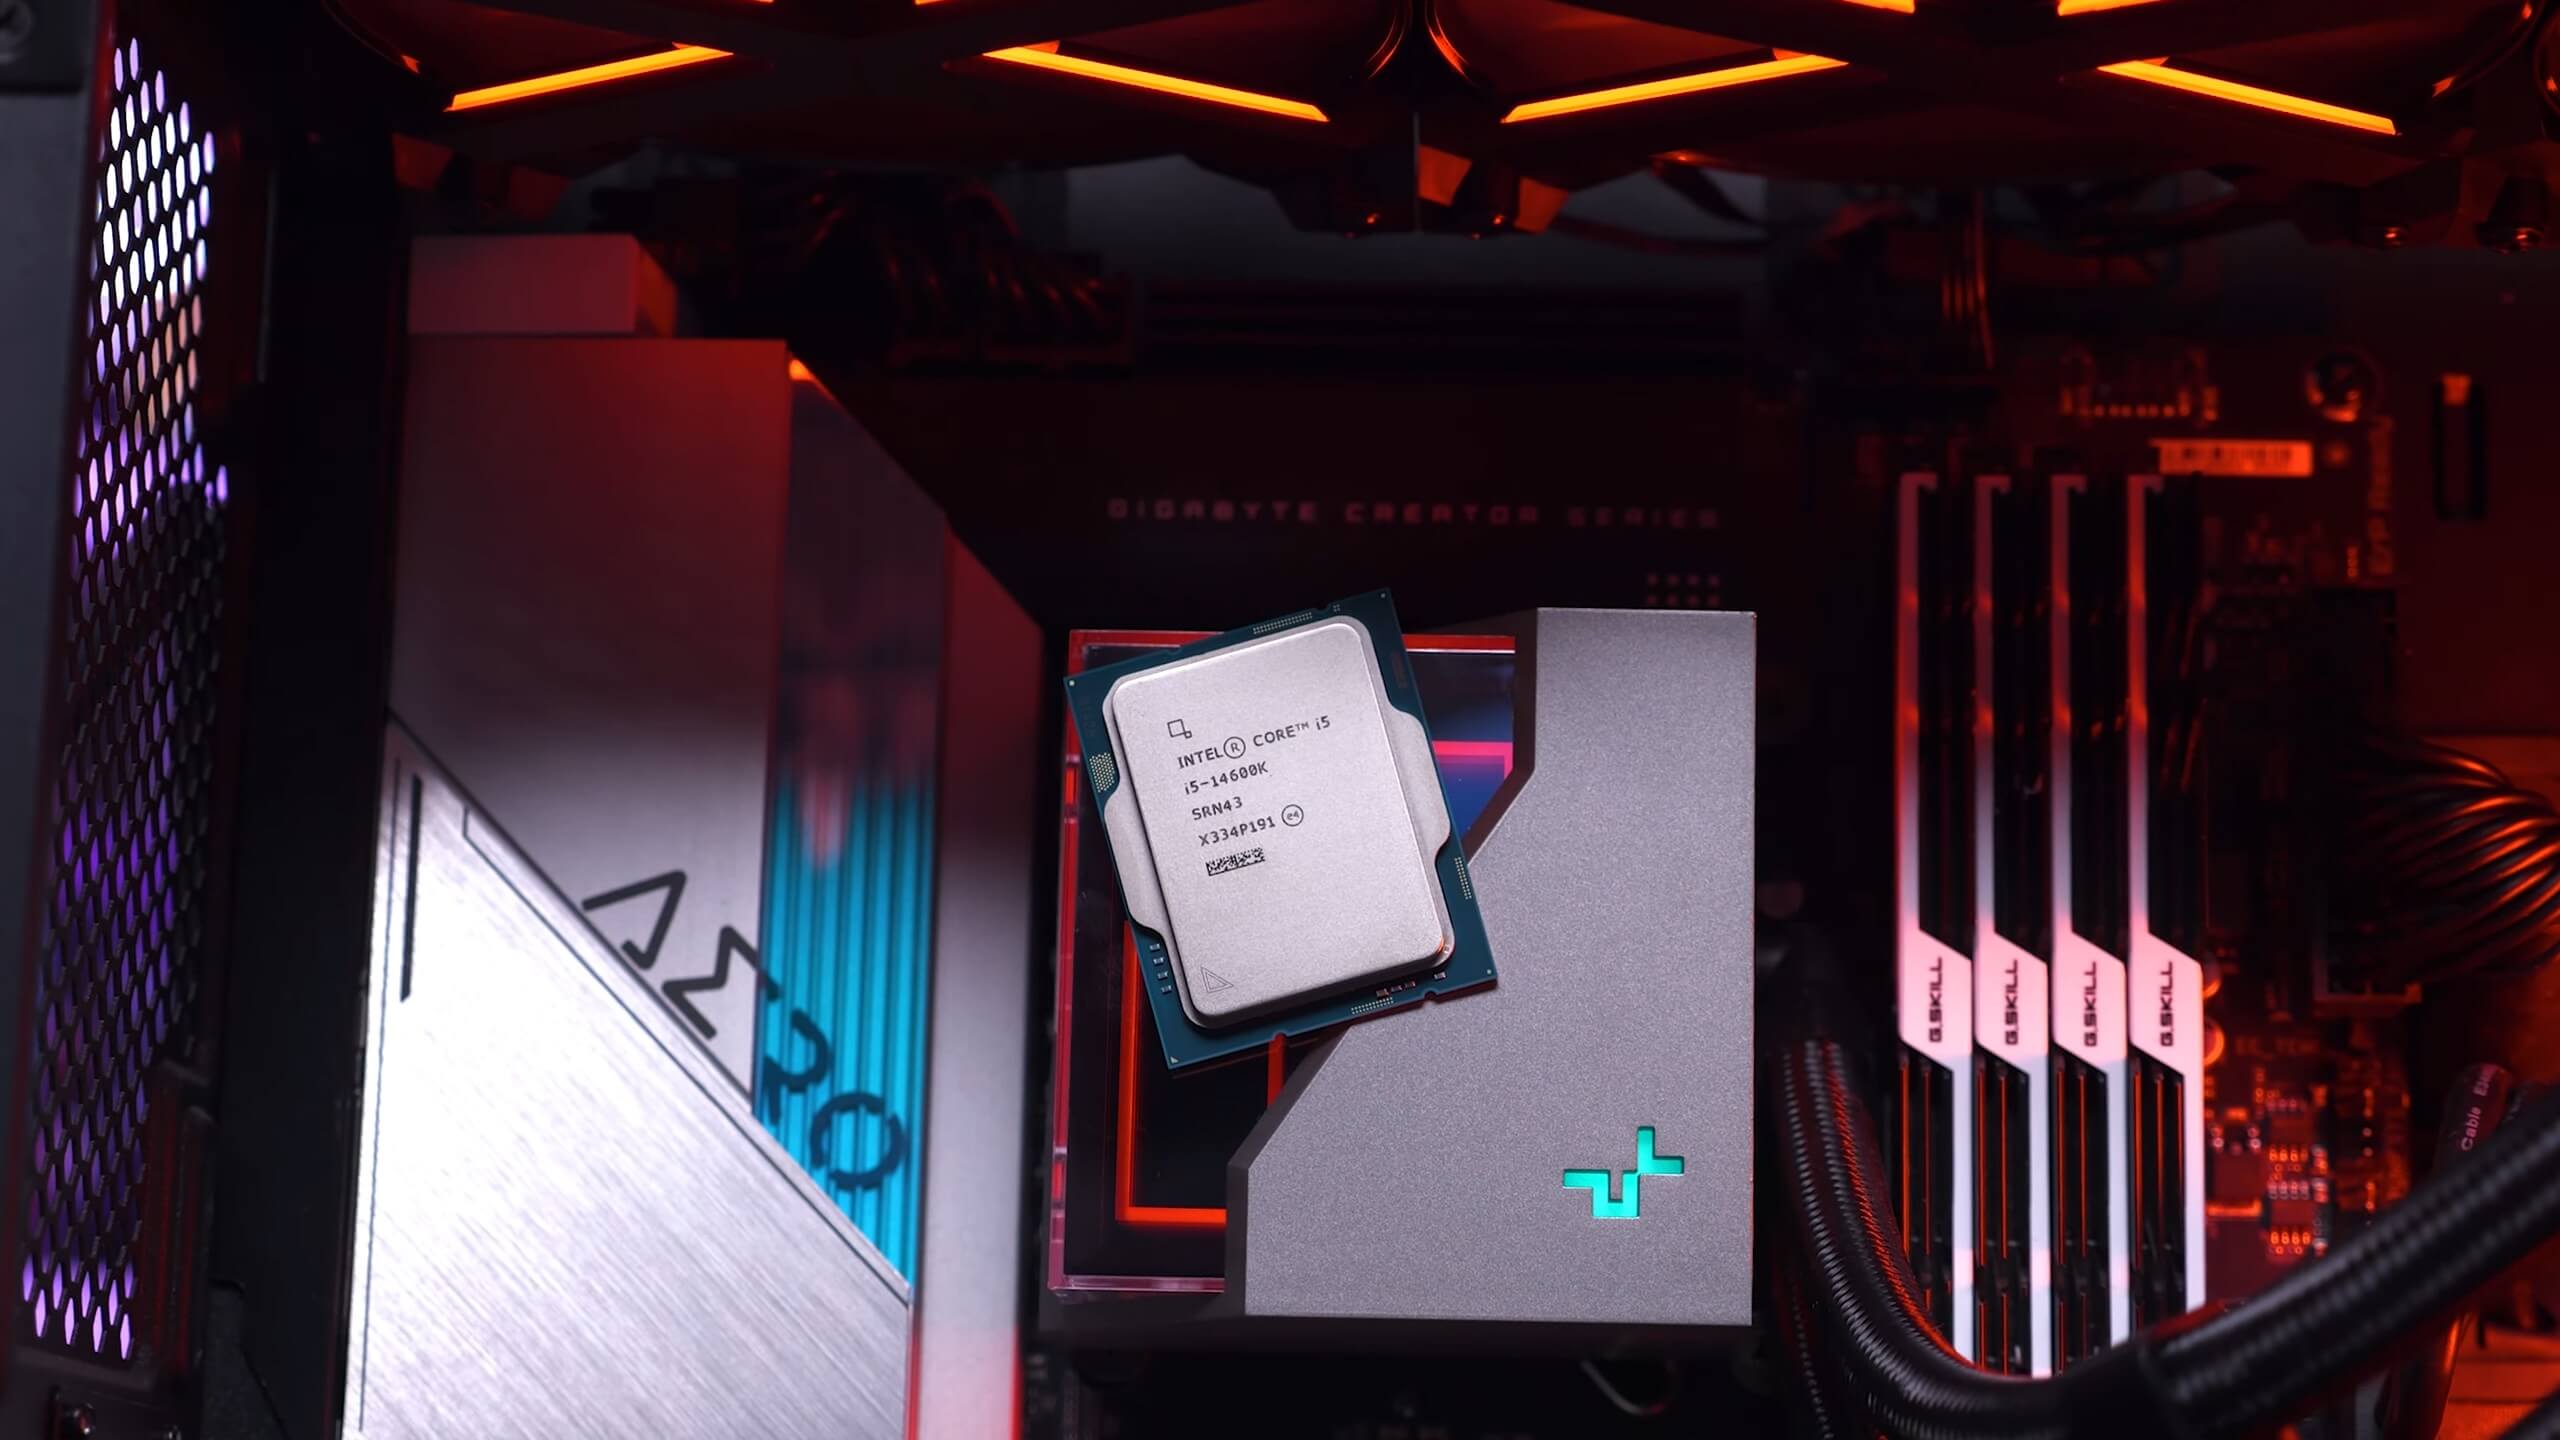
If your priority is productivity then the Core i7 is a better buy in our opinion, and the same is also true for gaming. But if your focus is solely gaming then the cheaper 7800X3D instantly becomes the go-to option.
Then there’s the Core i5-14600K which is set to cost $330, although the 13600K is already discounted at around $285, making it the better buy given they’re essentially the same CPU. Looking across our productivity benchmarks, the 14600K can be seen mixing it up with the Ryzen 7 7700X which costs $300 right now, and either option works well there. For gaming, the Core i5 was generally faster, though we’re talking ~4% faster on average across the 12 games tested, so overall the experience is going to be much the same.

In a nutshell, the advantage of the Intel CPUs is generally strong performance. We’d say performance is very consistent across the wide range of applications and games tested, so that’s great. The key disadvantages when compared to competing AMD parts is the much higher power consumption, and the platform, which as we’ve known for a long time is dead moving forward. There will be no more LGA1700 processors and that was true after the 13th-gen series was released given 14th-gen is nothing more than a minor rehash.
So if you buy a Core i7-14700K, for example, you’ll need a new motherboard if you wish to upgrade beyond the 14900K in the future. AMD’s AM5 platform on the other hand will support future CPUs. How many generations of CPUs is unclear at this point, but the potential to slot in what might be an 8800X3D on your existing AM5 board is a nice bonus. Whether or not AM5 will be as successful as AM4 has yet to be seen, so we wouldn’t weigh your decision on this alone, but it’s a factor to consider.


