Software tools for recording frame rates, measuring temperatures, or reporting power usage of graphics cards have been around for years, and there are plenty of excellent ones to choose from. Intel also introduced its own lightweight performance analyzer called PresentMon a few years ago and has routinely updated it since.
Most recently, Intel revamped PresentMon with the same goals, but giving it a fresh lick of paint and adding a few nifty features to boot. So let’s dive in and see how we can use this tool to analyze our gaming PCs.
Getting started, settings
You can download your copy of PresentMon from our software downloads section. Coming in at 107 MB, it’s not exactly a tiny download, roughly twice the size of MSI’s Afterburner.
PresentMon presents frame rates, frame times, and a host of other metrics in real-time – or logged over a period – for almost any game. It supports DirectX 9 through 12, OpenGL and Vulkan, and it’s available for Windows 10 and 11.
There are four sections to the menu:
- Process and overlay – choose which running process you wish to capture. PresentMon can also automatically select it for you. Additionally, you can set a hotkey to enable or disable the overlay that shows all the relevant information.
- Display presets – the overlay has three default layouts that you can cycle through. Alternatively, you can design your own custom layout with metrics such as CPU utilization, GPU temperature, GPU render times, etc.
- Capture – if you wish to log values over a specific timeframe, a dedicated hotkey (configurable) is provided for this purpose.
- Storage – access to the folder where recorded values and custom presets are saved.
The Settings option at the bottom right allows you to configure the size, position, and color of the overlay. If you have a large, high-resolution monitor, you may wish to enable the Graphics Scaling option and set the factor to something like 1.3 – when you switch this on, it defaults to 2.0 which might be a bit too large.
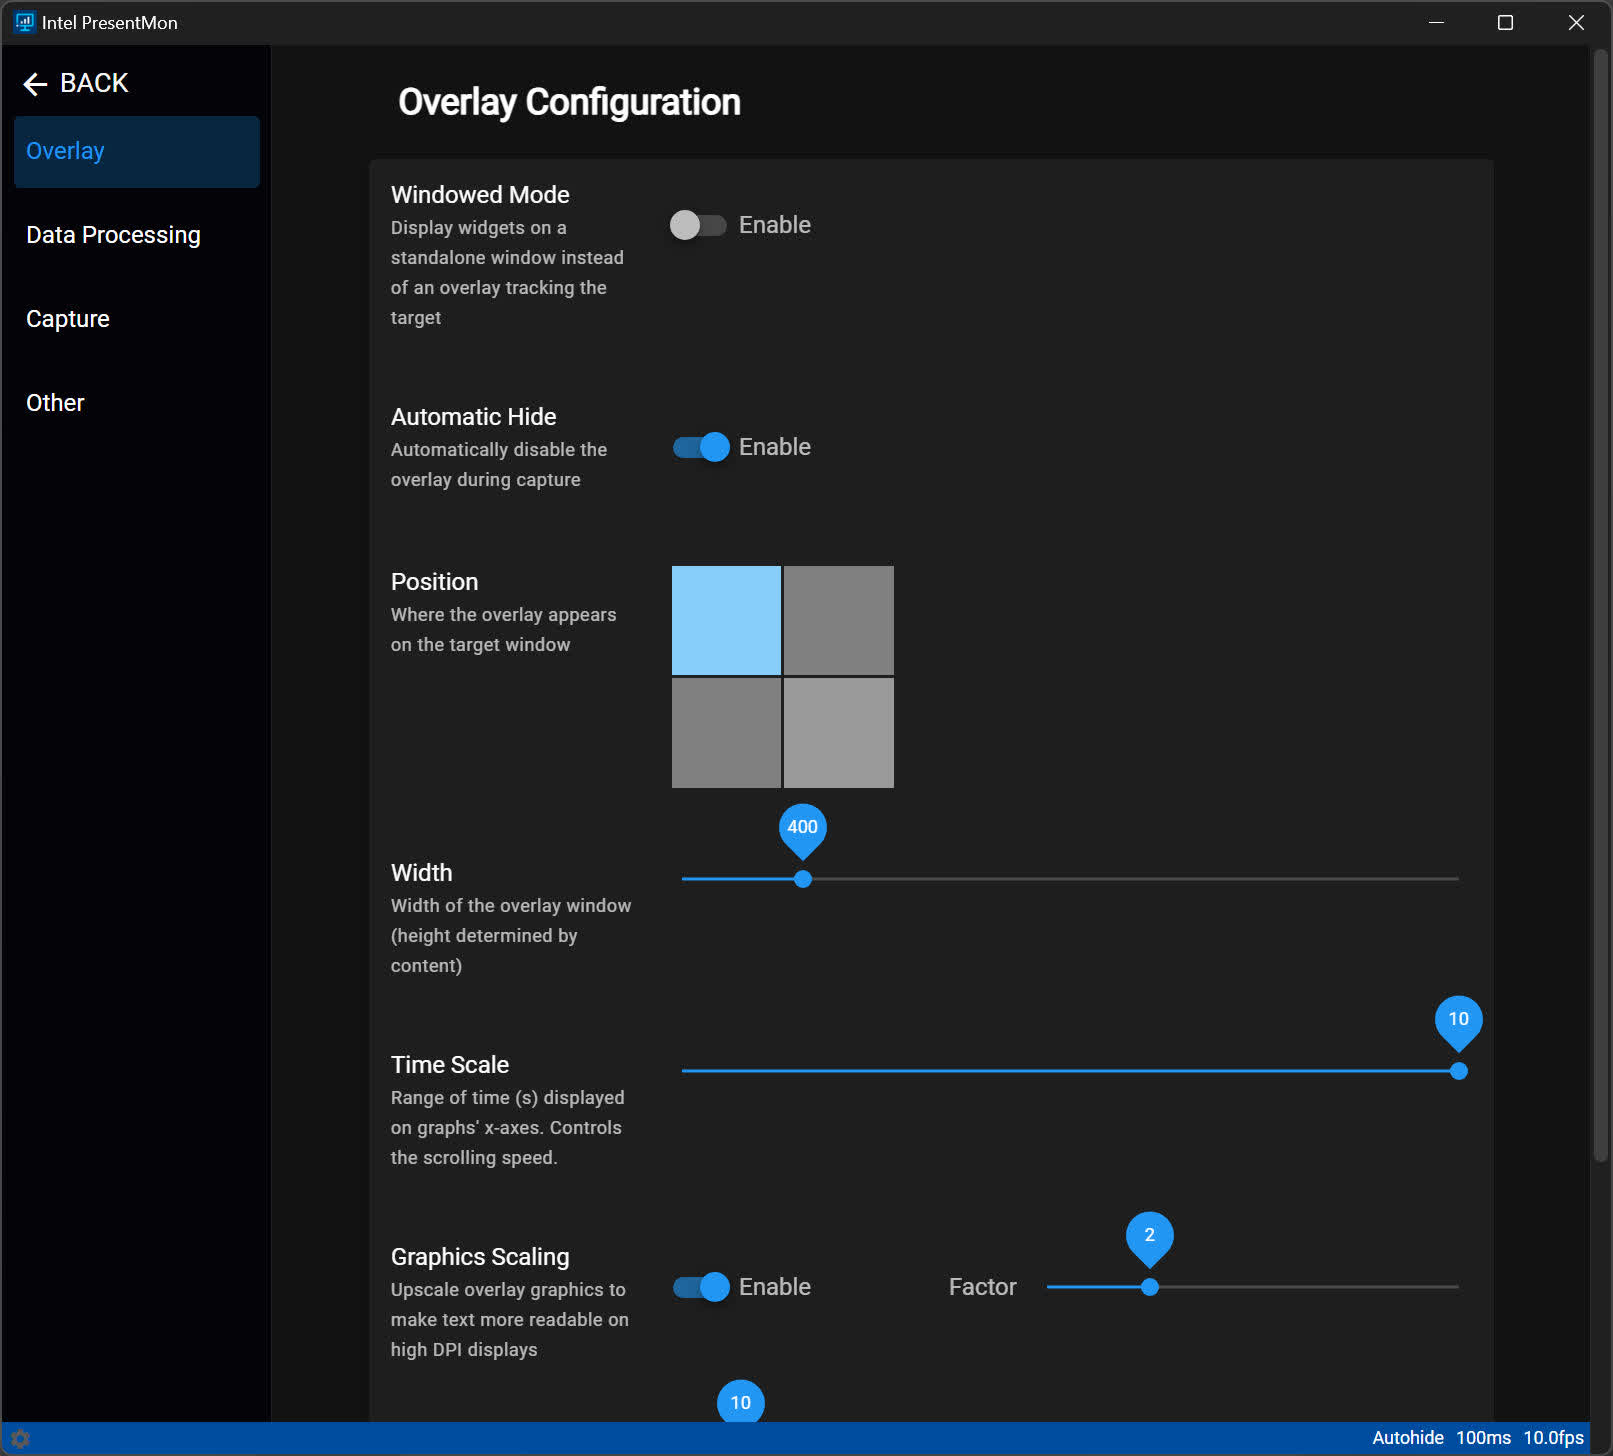
In the Data Processing section, you can modify the interval at which PresentMon checks the graphics API for information. The standard value is 100 milliseconds (10 Hz), suitable for most cases. Similarly, you can adjust the monitoring frequency for power and temperature.
In this section you can also change the duration over which averages are determined. The default is 1000 milliseconds (meaning the average is calculated every second). Avoid setting this value too low, like 100 ms, as the figure will lose its significance.

The options in the Capture section are about creating a summary file of any captures and a setting to make PresentMon ignore the most commonly run processes in Windows, so that it doesn’t accidentally try to capture those instead of the game.
Overlay presets: Basic, GPU Focus, and Power/Temp
Let’s move on to examine what is shown in the overlay when selecting one of the three presets – Basic, GPU Focus, and Power/Temp. To do this, we fired up the old classic Half-Life 2, and ran it all on a system using an Intel Core i7-9700K, with 32 GB of DDR4-3200, and an Nvidia GeForce RTX 4070 Ti.
The standard Basic option shows only three metrics, all related to each other: in bold digits is the average frame rate, followed by the 99% percentile value – this figure is the same as our 1% Low values when we review CPUs and GPUs.
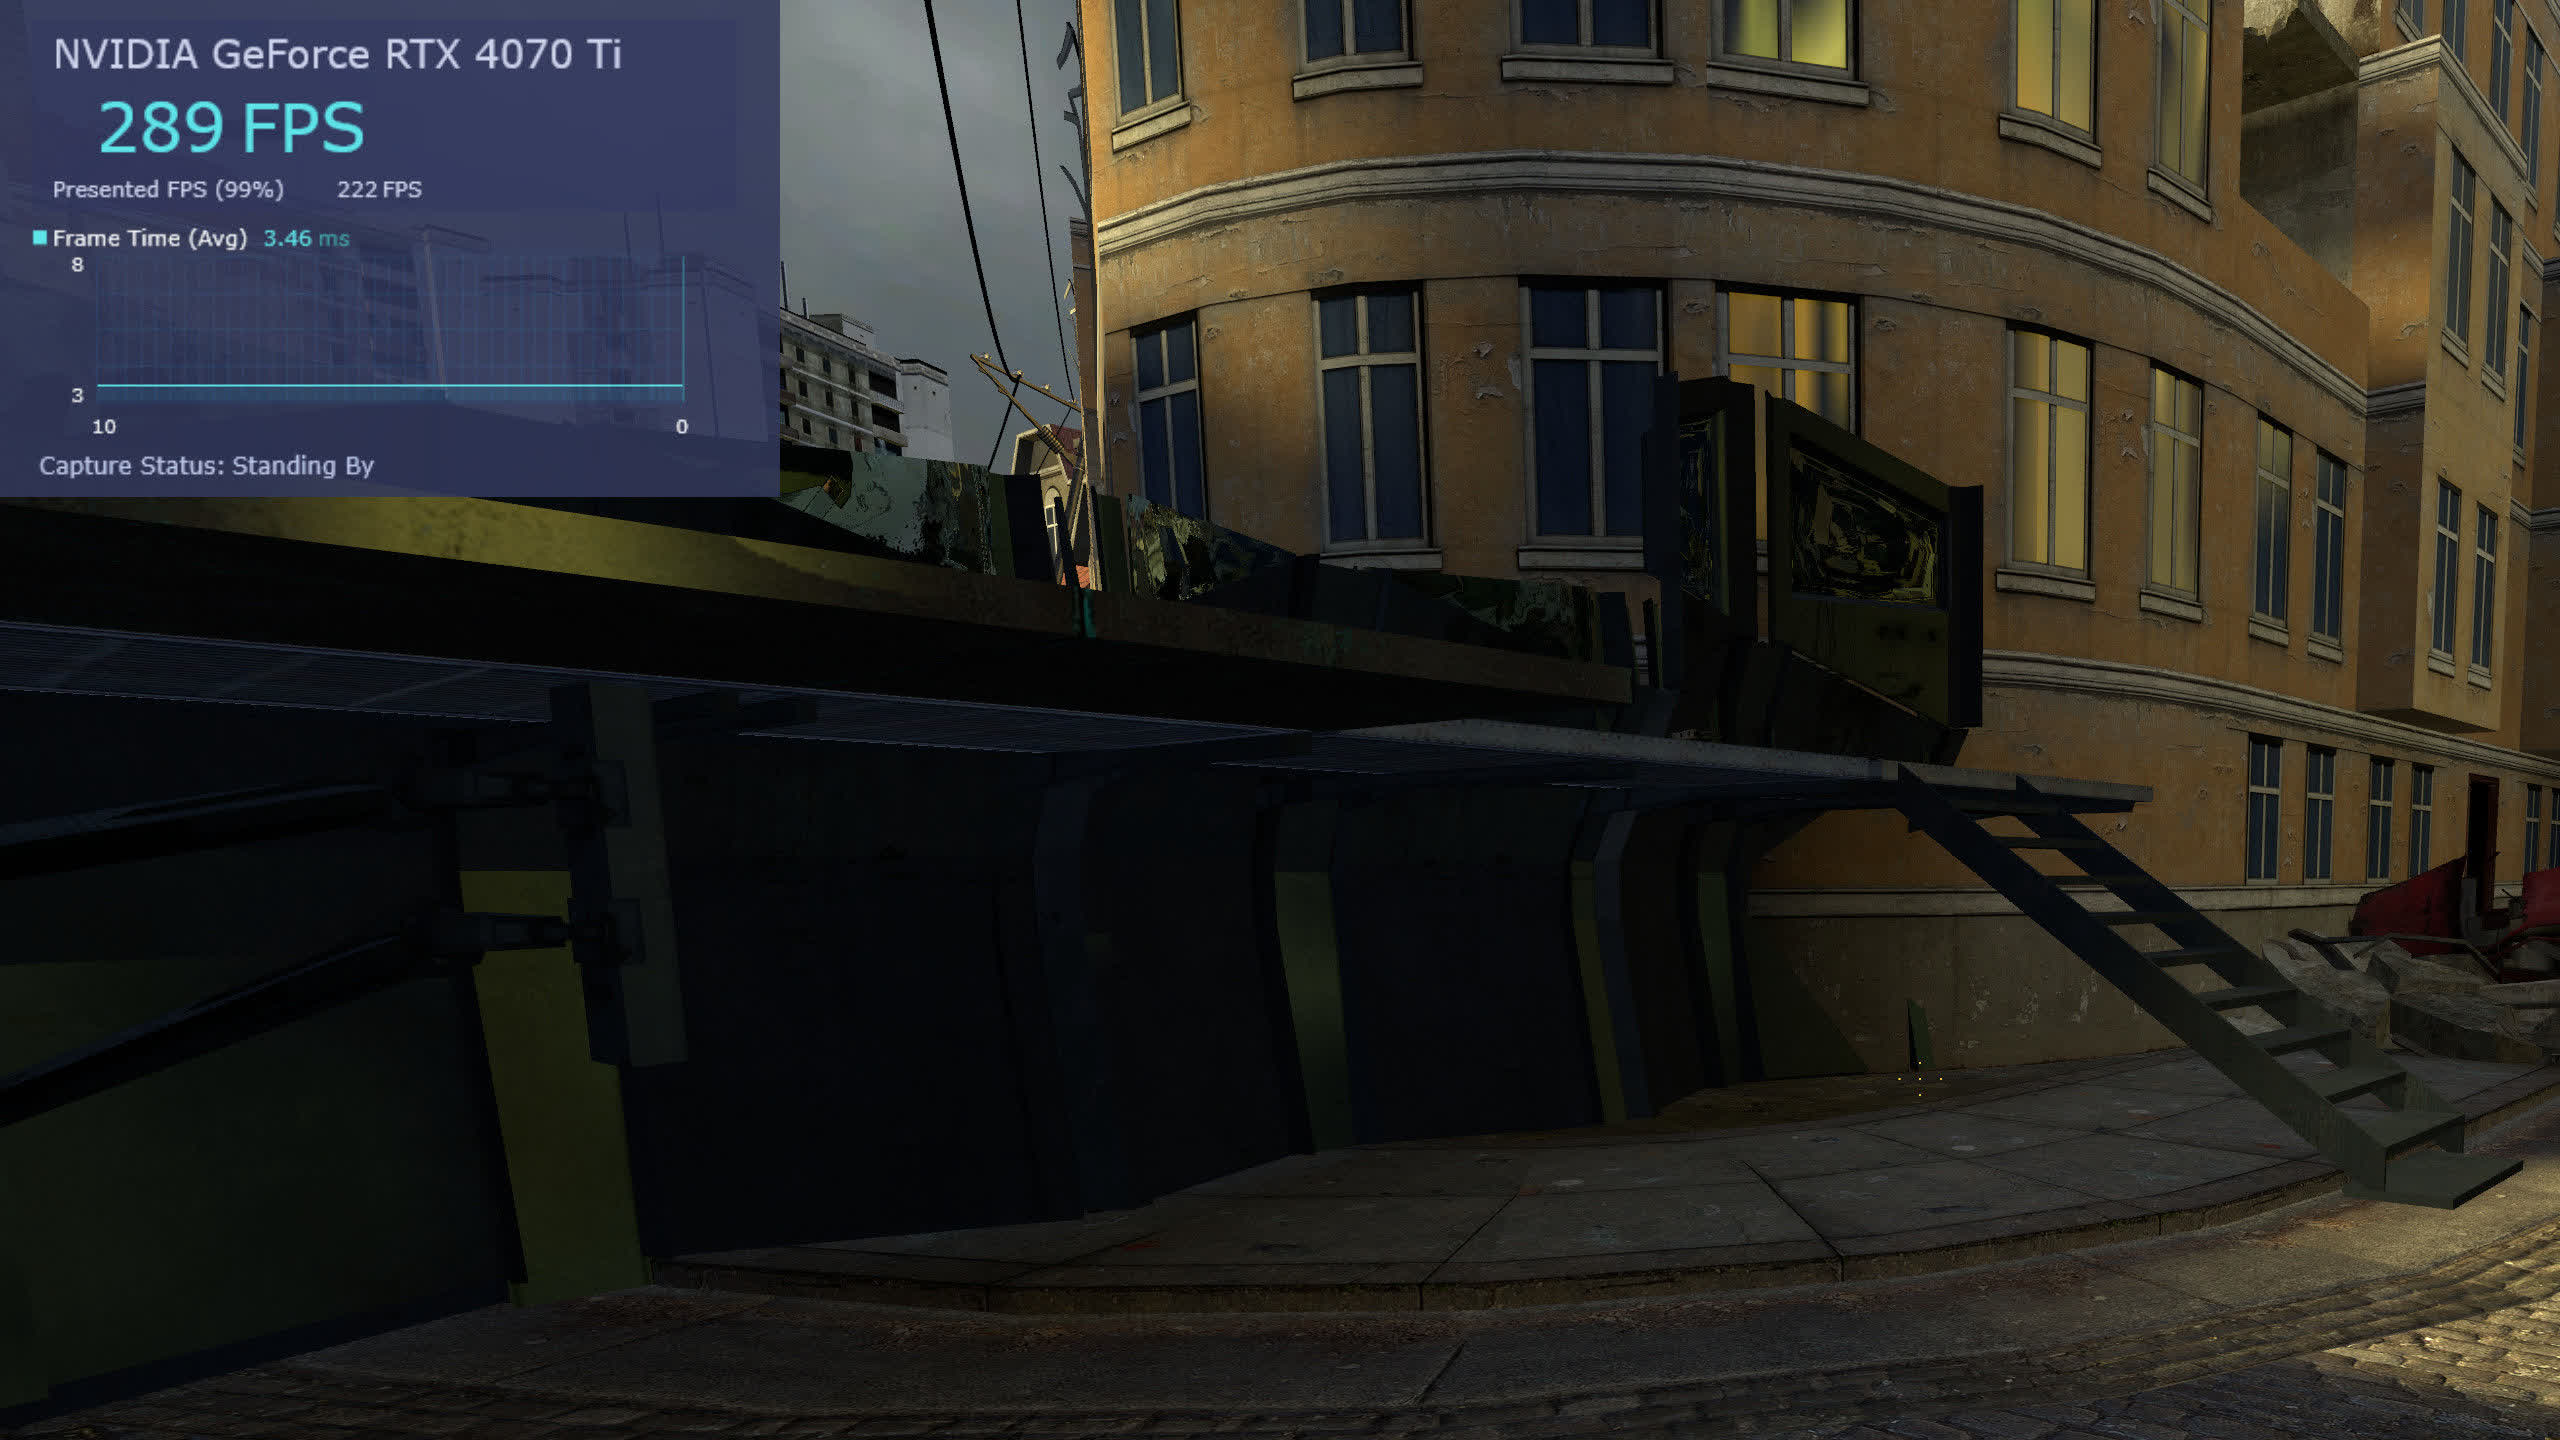
The third metric displays the average frame times – the duration between the start of each successive frame and its display on the monitor, measured over a period of 1 second. Frame times are useful for identifying stuttering in games. A brief upward spike indicates a temporary slowdown, signifying an issue causing a brief delay.
The GPU Focus preset is all about the graphics card (surprise!), showing lots of useful information. It covers all from the Basic preset, but adds something that’s especially handy.
The reported Frame Time represents the average number of milliseconds between each “Present” instruction issued by the graphics API, instructing the system to begin displaying the frame on the monitor. While every component of your PC and the game itself can influence this duration, the most significant contributors are typically the CPU and the system as a whole.
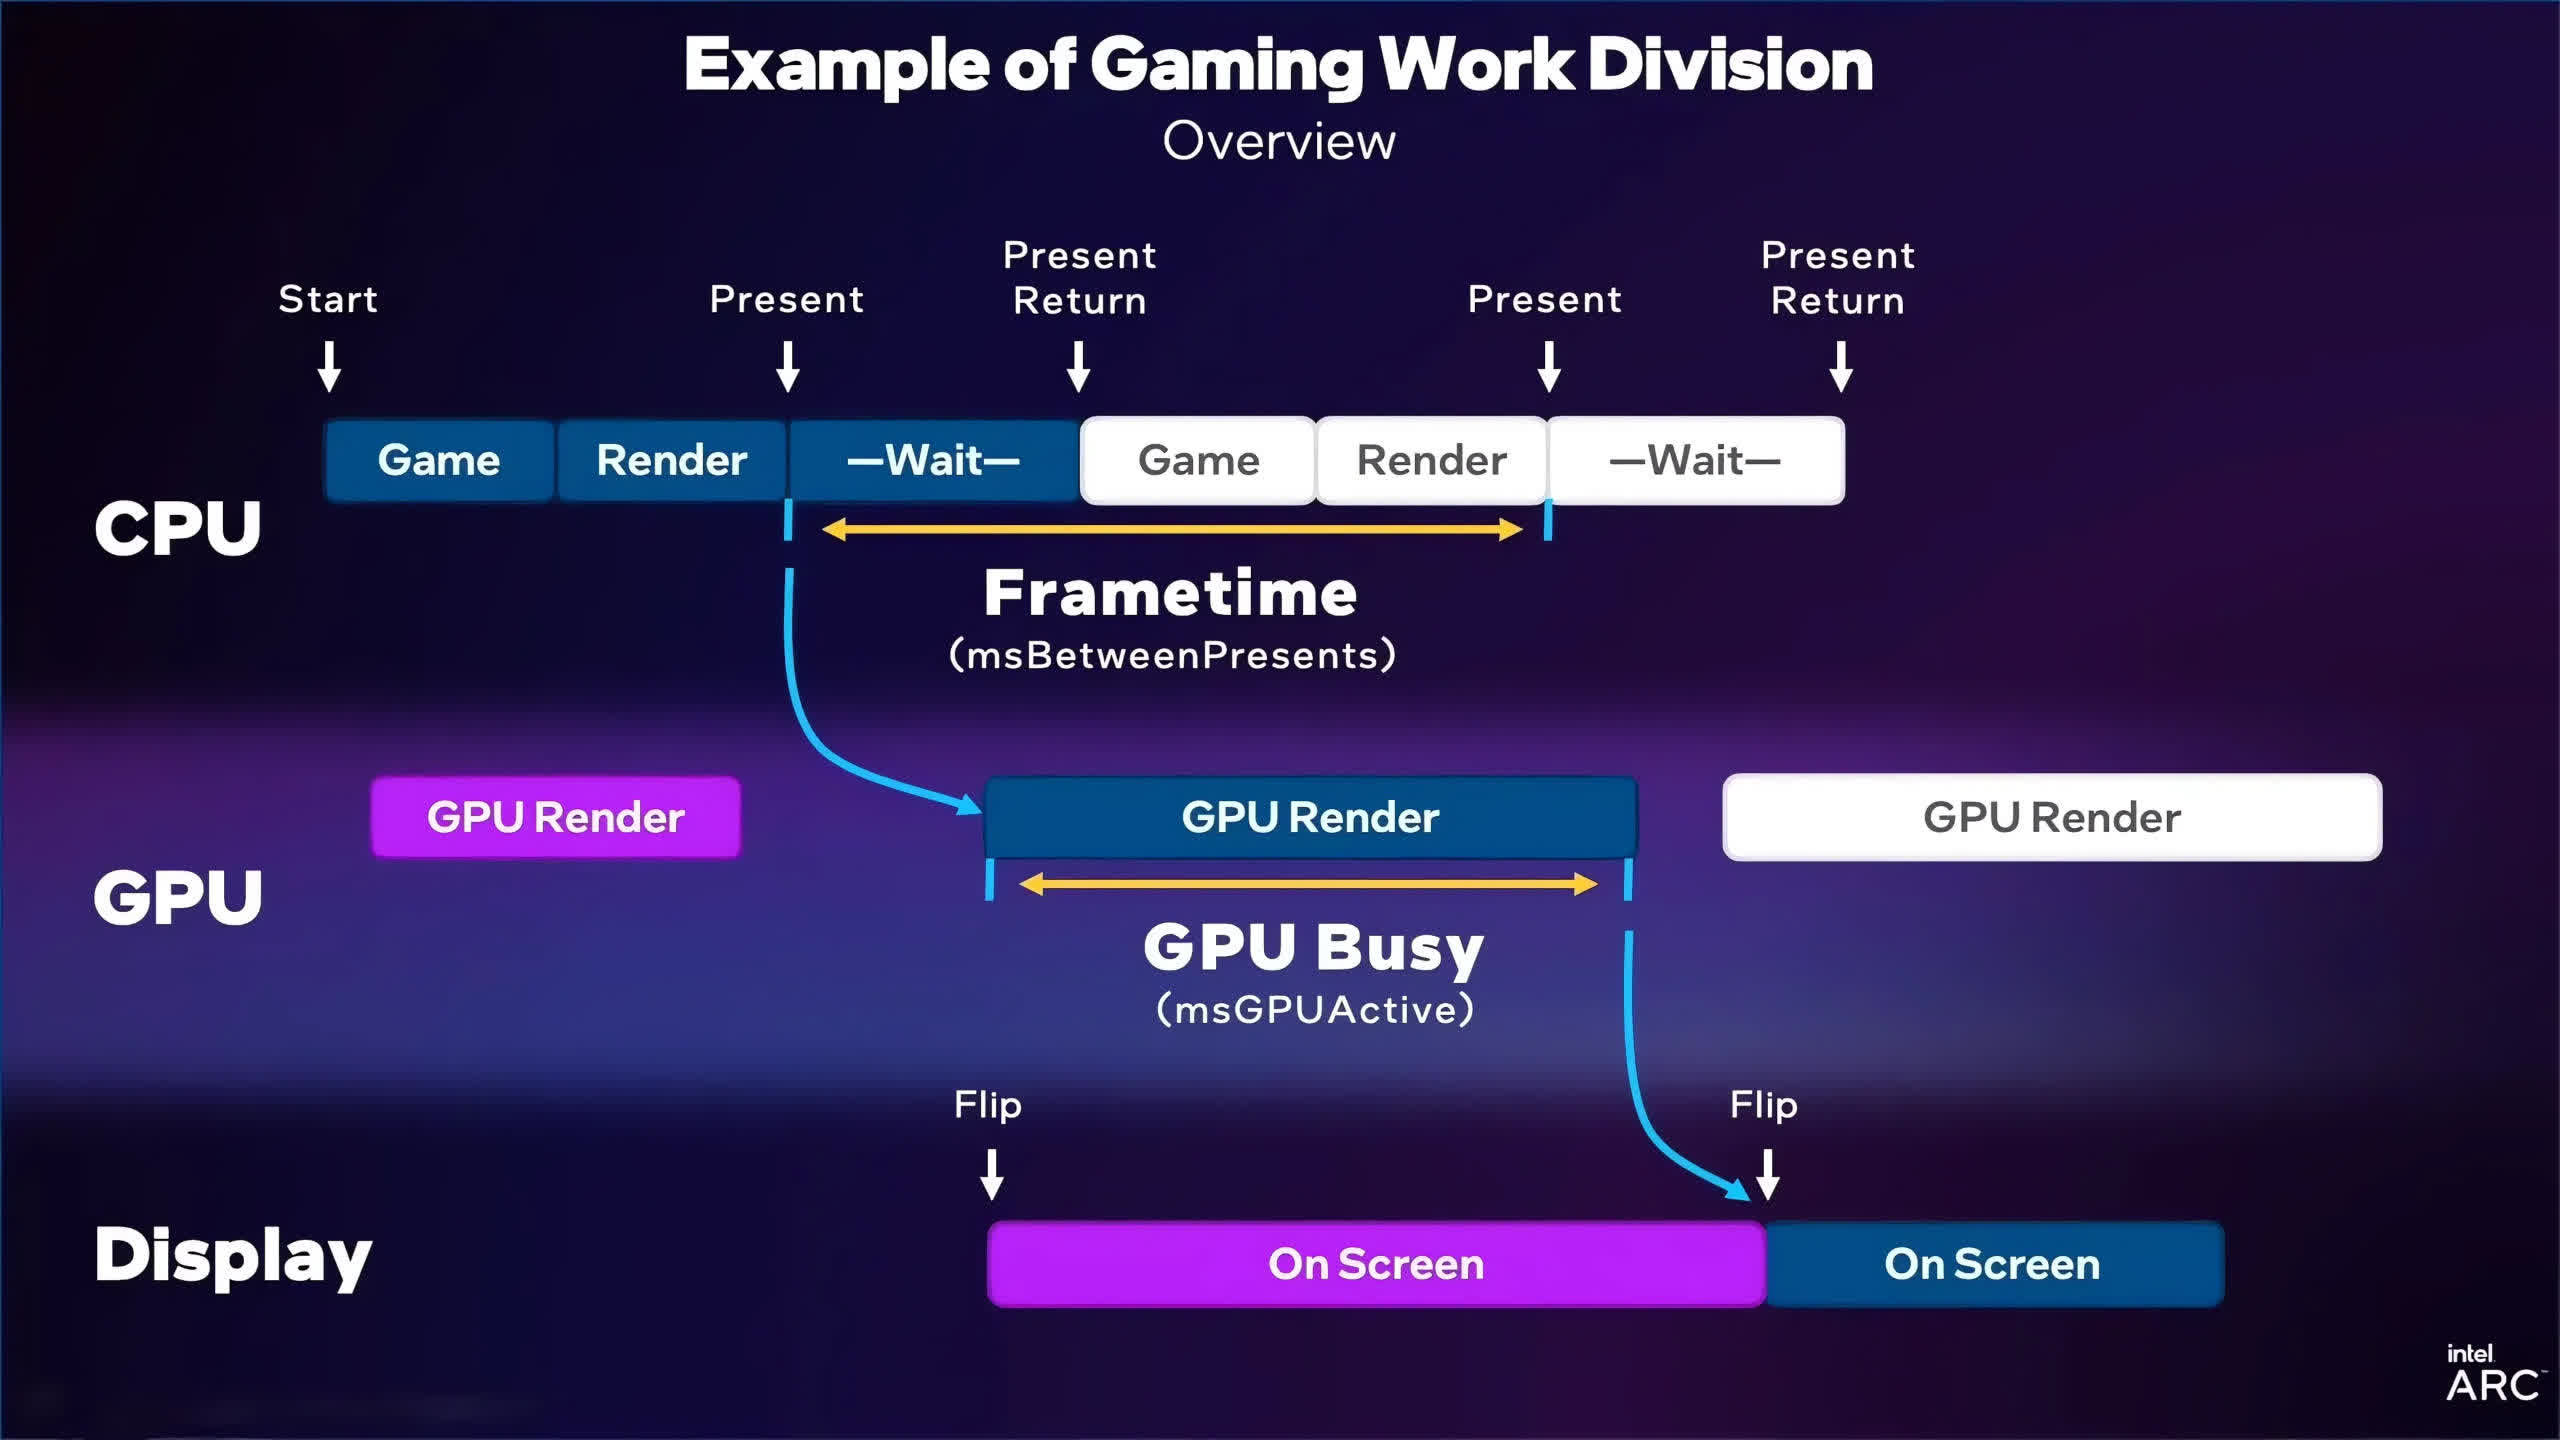
The GPU Busy time is Intel’s newest feature in PresentMon: it’s a measure of how long the graphics processor spends rendering the frame; the timer starts the moment the GPU receives the frame from a queue, to the moment when it swaps the completed frame buffer in the VRAM for a new one.
If the Frame time is much longer than the GPU Busy time, then the game’s performance is being limited by factors such as the CPU’s speed. For obvious reasons, the former can never be shorter than the latter, but they can be almost identical and ideally, this is what you want in a game.
If you look at our Half-Life 2 example, the mean GPU time is 1.42 ms whereas the mean frame time is 3.46 ms:
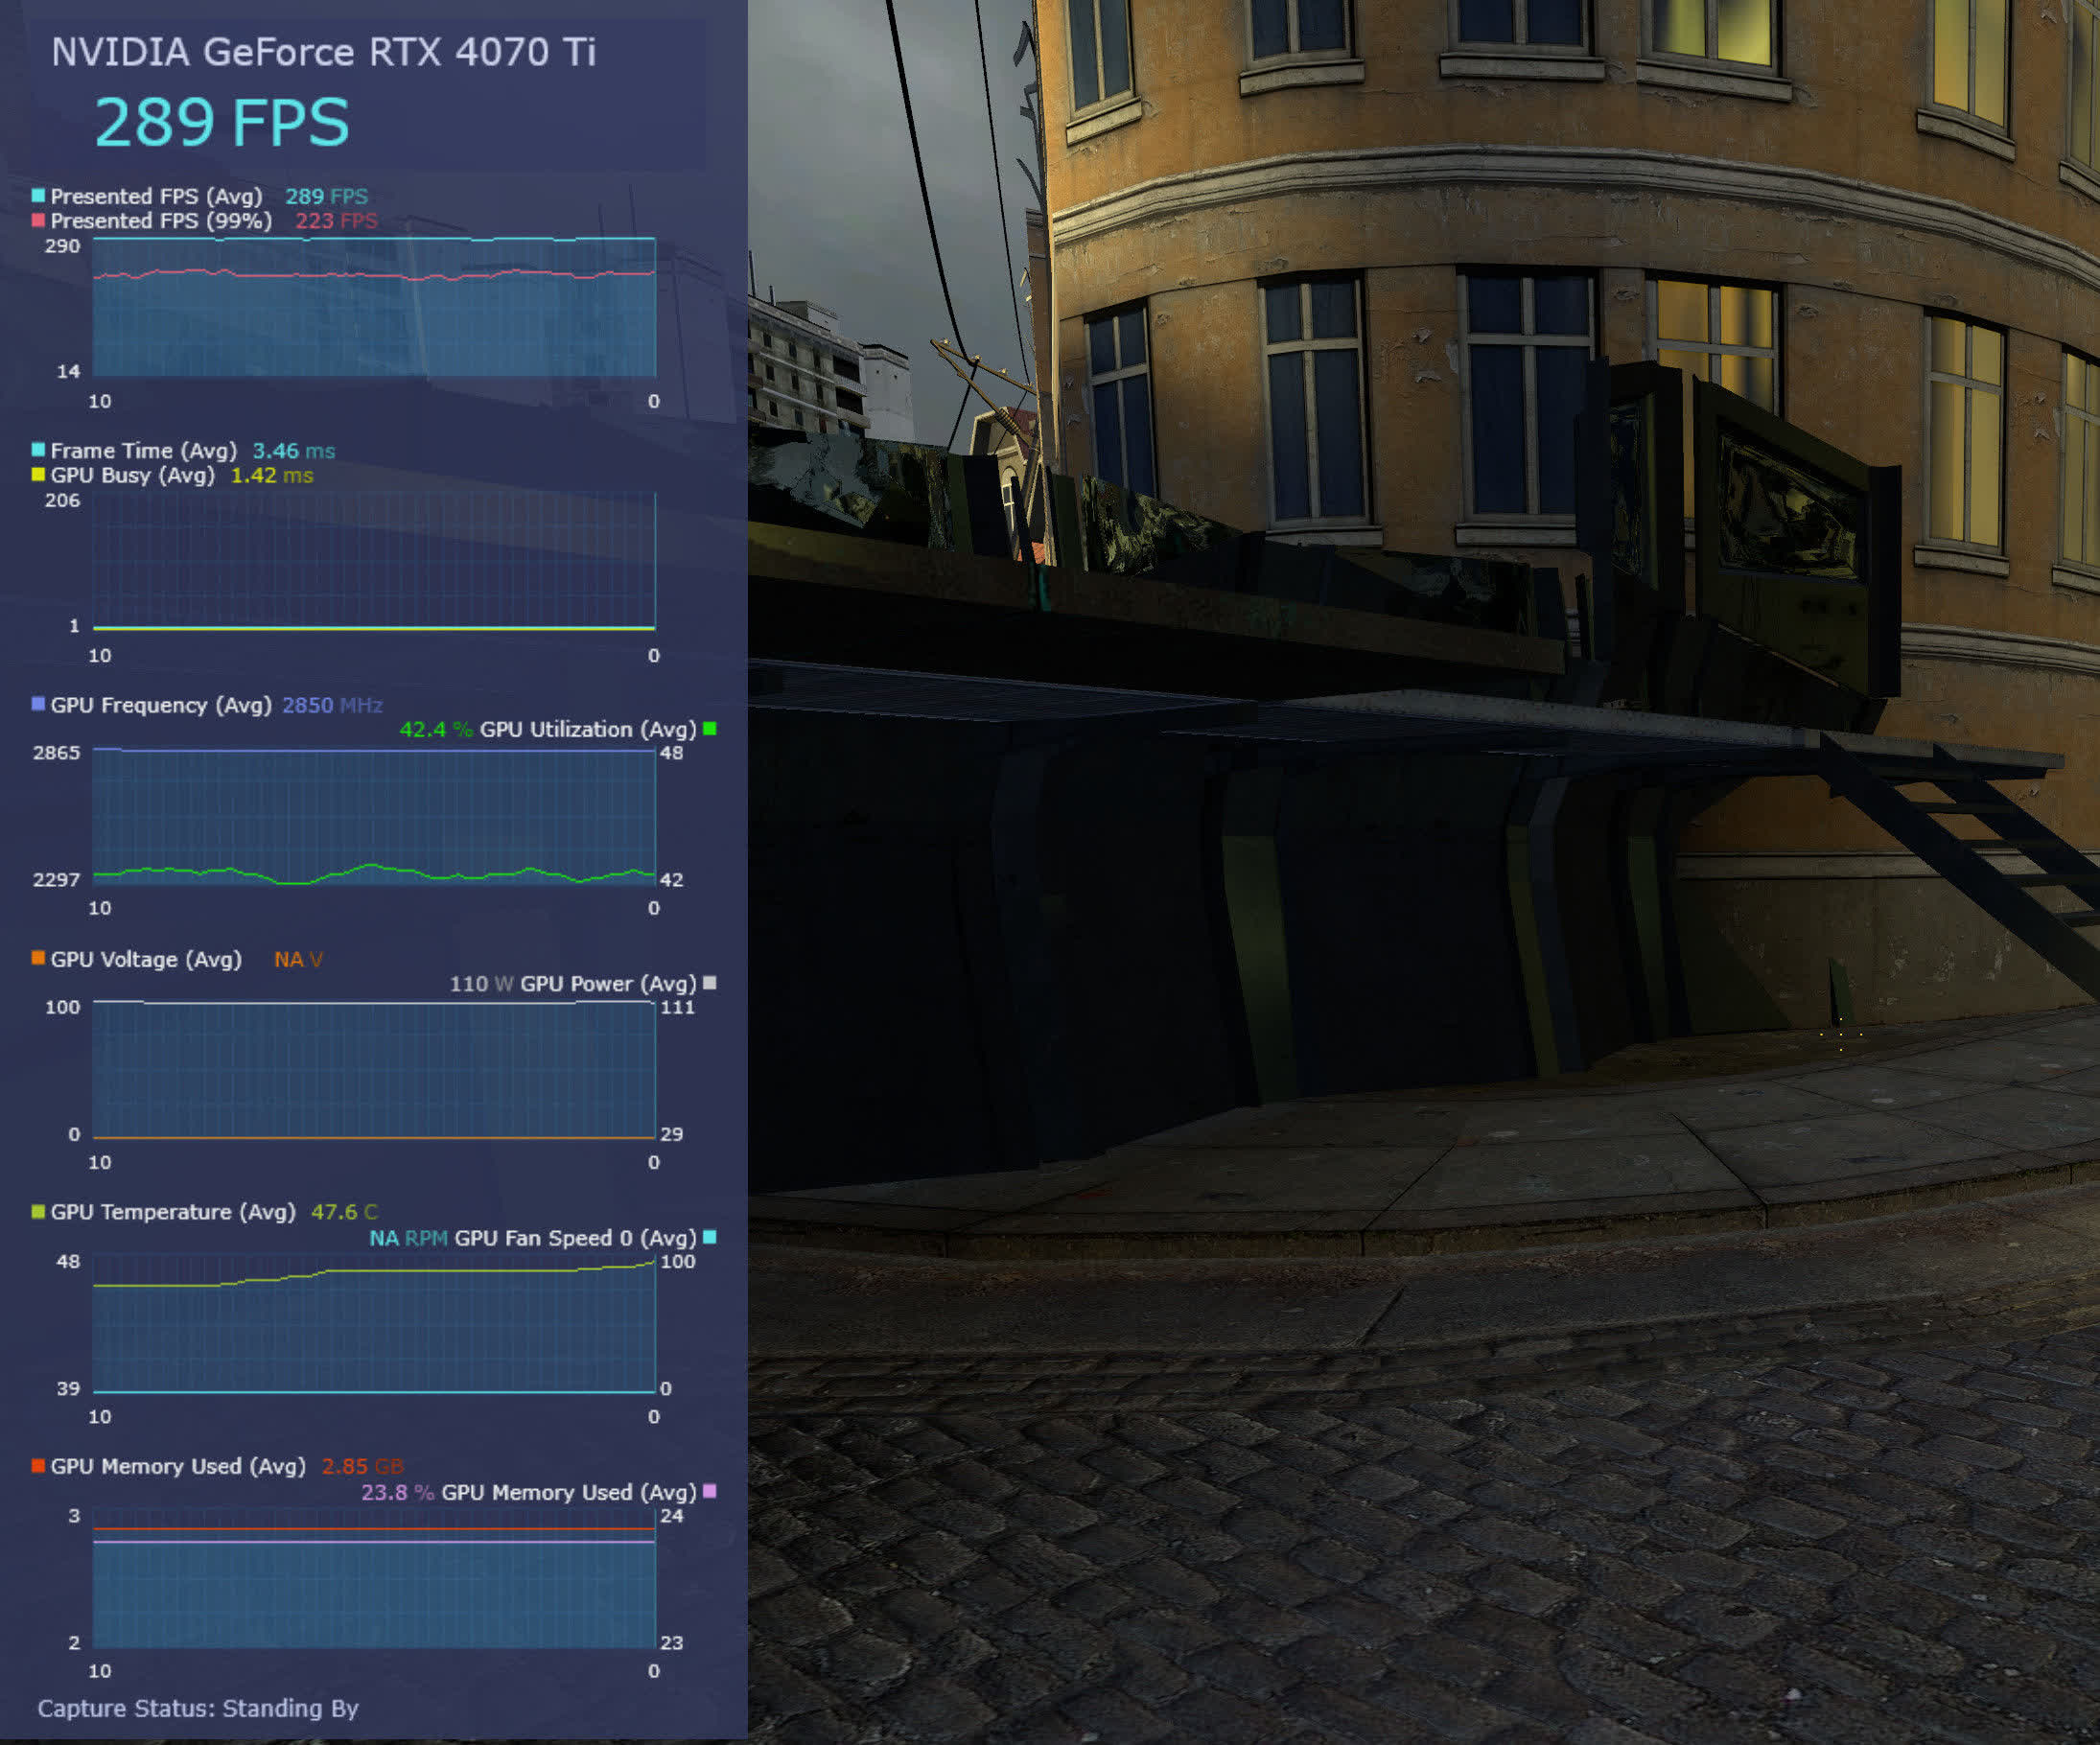
This is telling us that the graphics card only contributes ~40% of the total time taken to get a frame out onto the monitor; the rest of it is affected by the CPU, RAM, the OS, and the game itself. This is corroborated by the fact that the reported GPU utilization is averaging around the same percentage.
We’ll explore this metric in more detail later, but for now, let’s move on to the rest of the GPU Focus preset.
You’re given things like GPU clock speed, graphics card fan RPM, voltages, power, and so on, but notice how the reported fan speeds are blank – this happened in all games we tested, so it’s clear there’s still some work remaining to perfect this tool.
The “GPU Memory Used” value doesn’t represent actual usage. Instead, it measures what is termed the “Local Budget” in Microsoft PIX, a developer-level analysis tool. This is fundamentally akin to VRAM allocation. Therefore, while it provides some insight, it isn’t the most precise metric for determining how much of your card’s memory is genuinely in use.

The Power/Temp preset holds no surprises – it’s perhaps of more use than the Basic preset, simply because it provides additional details without being overly busy. We verified the reported power and temperature values using other applications, but as we tested this on just one graphics card, we can’t be certain it will work fine with others – it comes down to whether your GPU and drivers actively monitor and present such details, as PresentMon can’t directly capture that information.
And this could also be an issue with any Custom preset you configure. There’s a decent range of metrics to record and display, but we found that on this particular system, many of them just produced blank values – even when other tools such as GPU-Z showed them without issue.
In fairness to Intel, this latest version of PresentMon remains in beta, so with luck, this will get remedied in future releases.
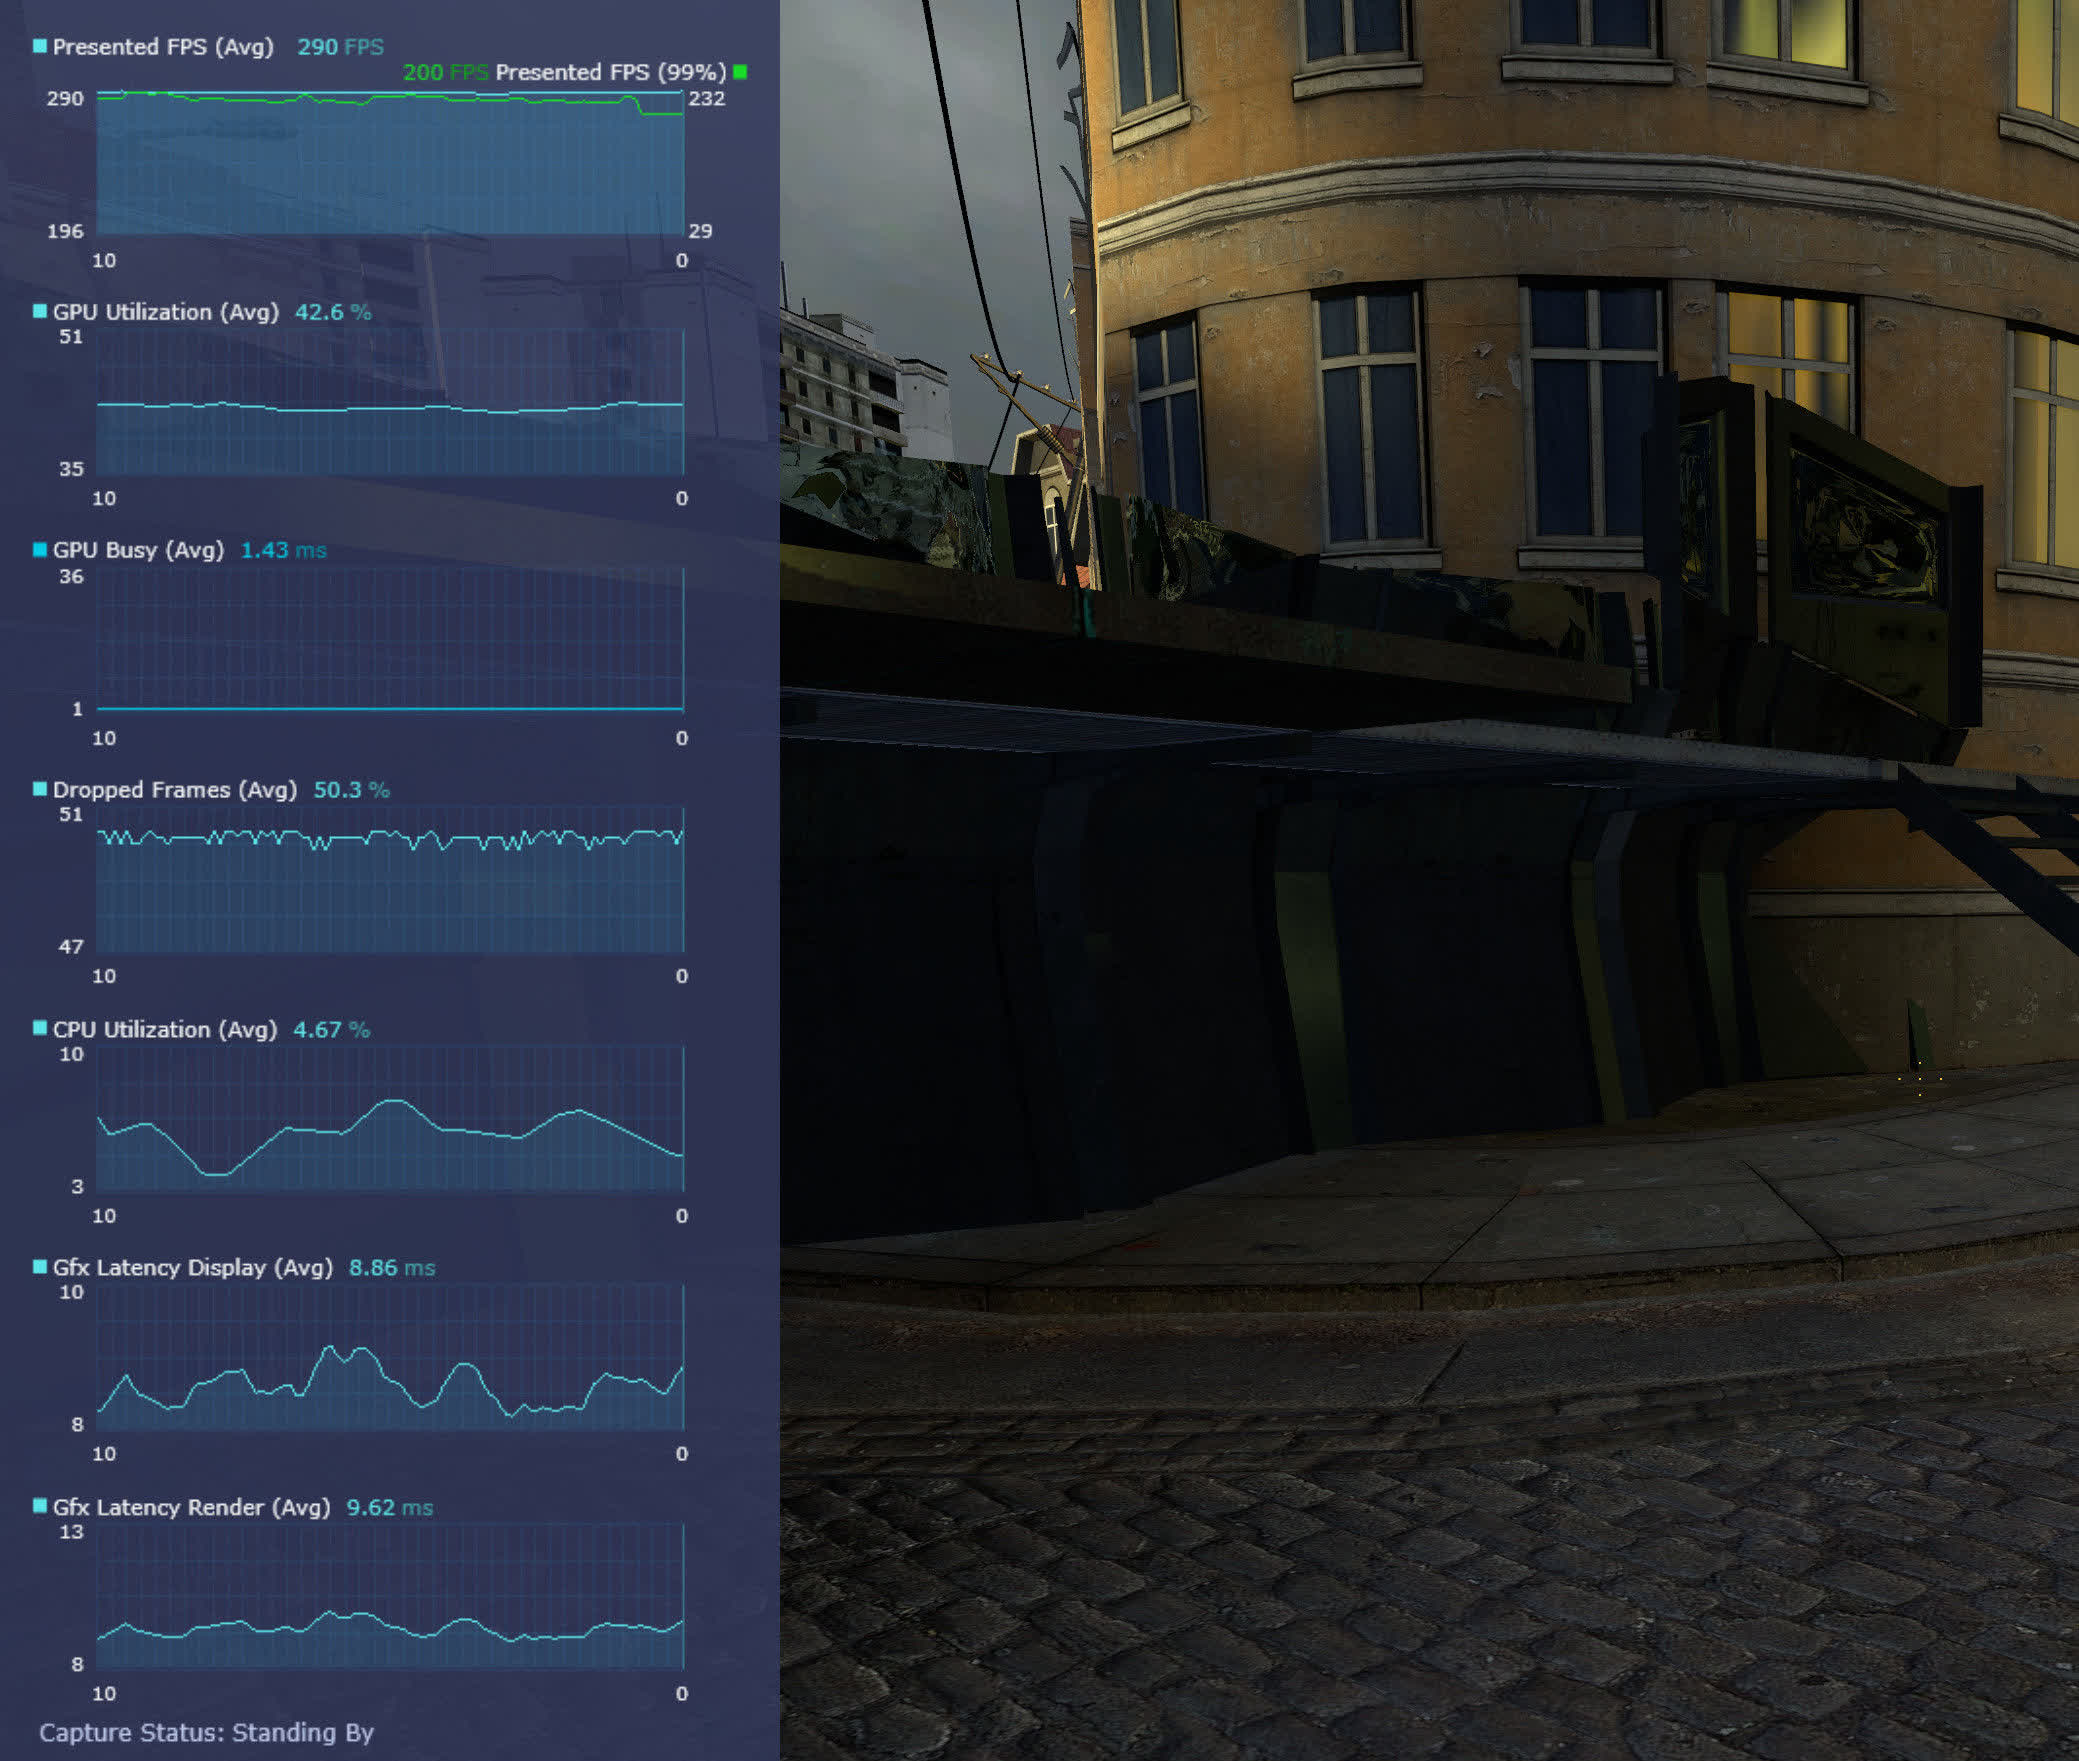
We did get plenty of them to work, though, and the above set provides quite a good insight as to what’s going on with our hardware when running Half-Life 2.
We can see that the GPU utilization isn’t especially high, but the CPU figure is very low – and just look at the percentage of dropped frames!
It all makes sense when you understand that, by default, the engine in Half-Life 2 has a cap of 300 fps. This can be overridden by the use of a console command, but this is why we’re losing so many frames – the engine goes through the motions of creating more frames, but then doesn’t submit them to the GPU or stores and then removes them from the render queue.
The Latency Render time is the number of milliseconds a frame spends in the queue combined with the time it takes to actually render it; the GPU busy time shows that the majority of this latency is spent in the queue. Of course, there’s always the possibility that PresentMon isn’t reporting these values correctly and Half-Life 2 is now a legacy DirectX 9 game.
Analyzing game performance with PresentMon
To round off this guide, we’ll take a look at a few games and see what information we can glean from them, using PresentMon’s GPU Focus preset.
Let’s start by looking at the main menu screen of The Last of Us Part 1 (TLOU). Now, before you think we’ve lost the plot a bit here, do bear with us. Like many recent games, TLOU compiles all of its shaders at the main menu, especially if you’ve recently updated drivers or the game itself. While this process can be interrupted, doing so results in noticeable stuttering during gameplay. Admittedly, the compilation is time-consuming, but pay special attention to the Frame and GPU Busy times.
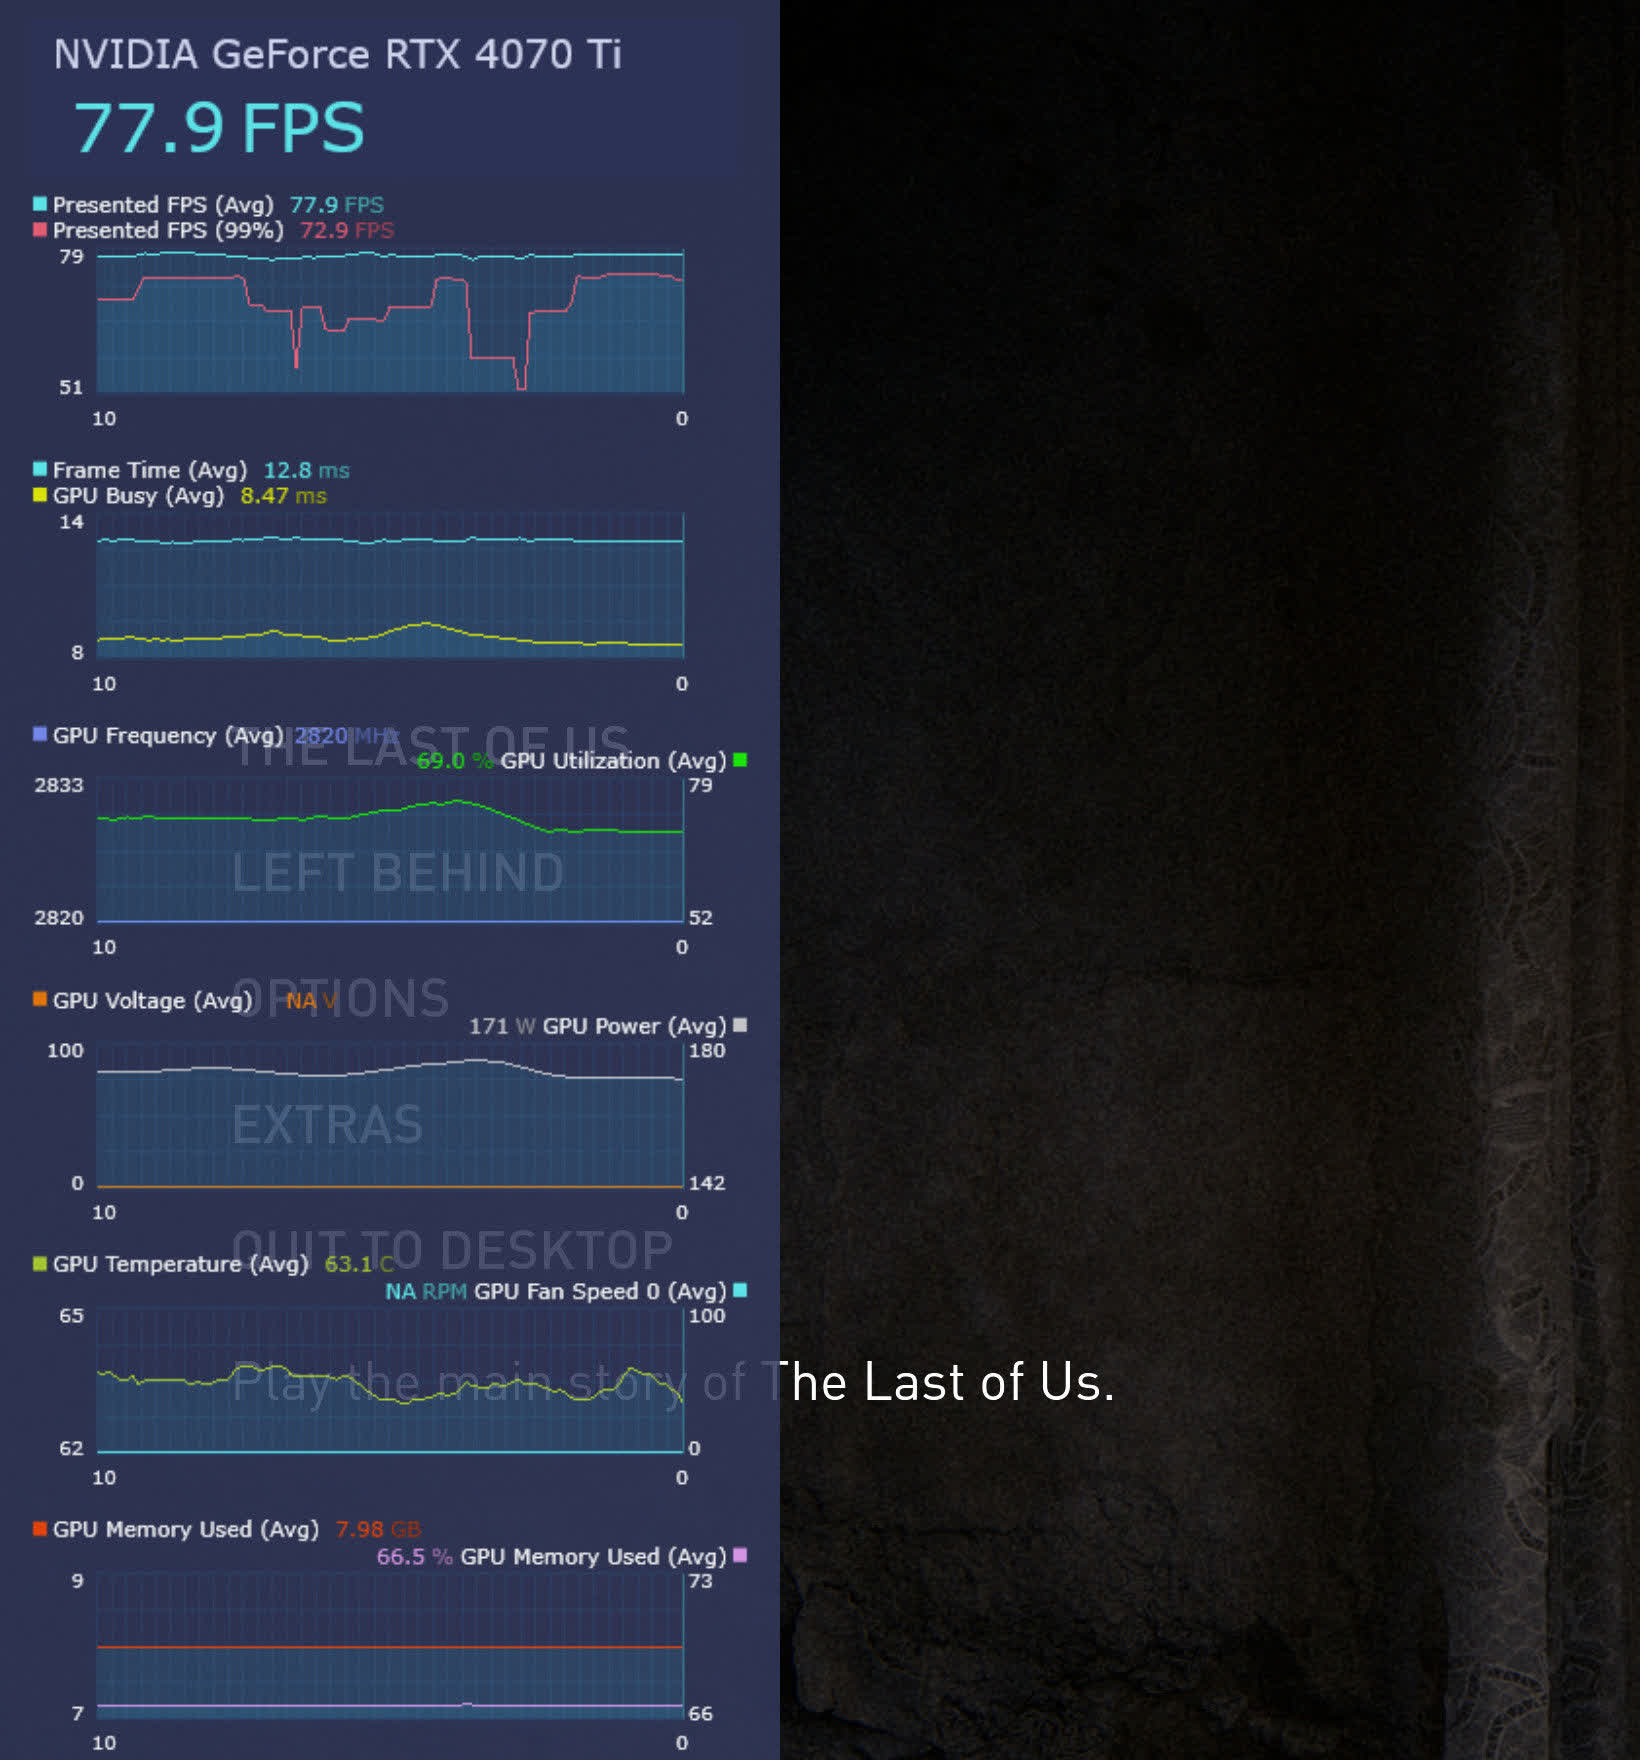
Notice how there’s around a 4 millisecond difference between the two? TLOU actively renders the menu as a 3D scene, which is why there’s a fair bit of GPU activity, but at the time of taking this snapshot, the engine was still compiling all of the shaders.
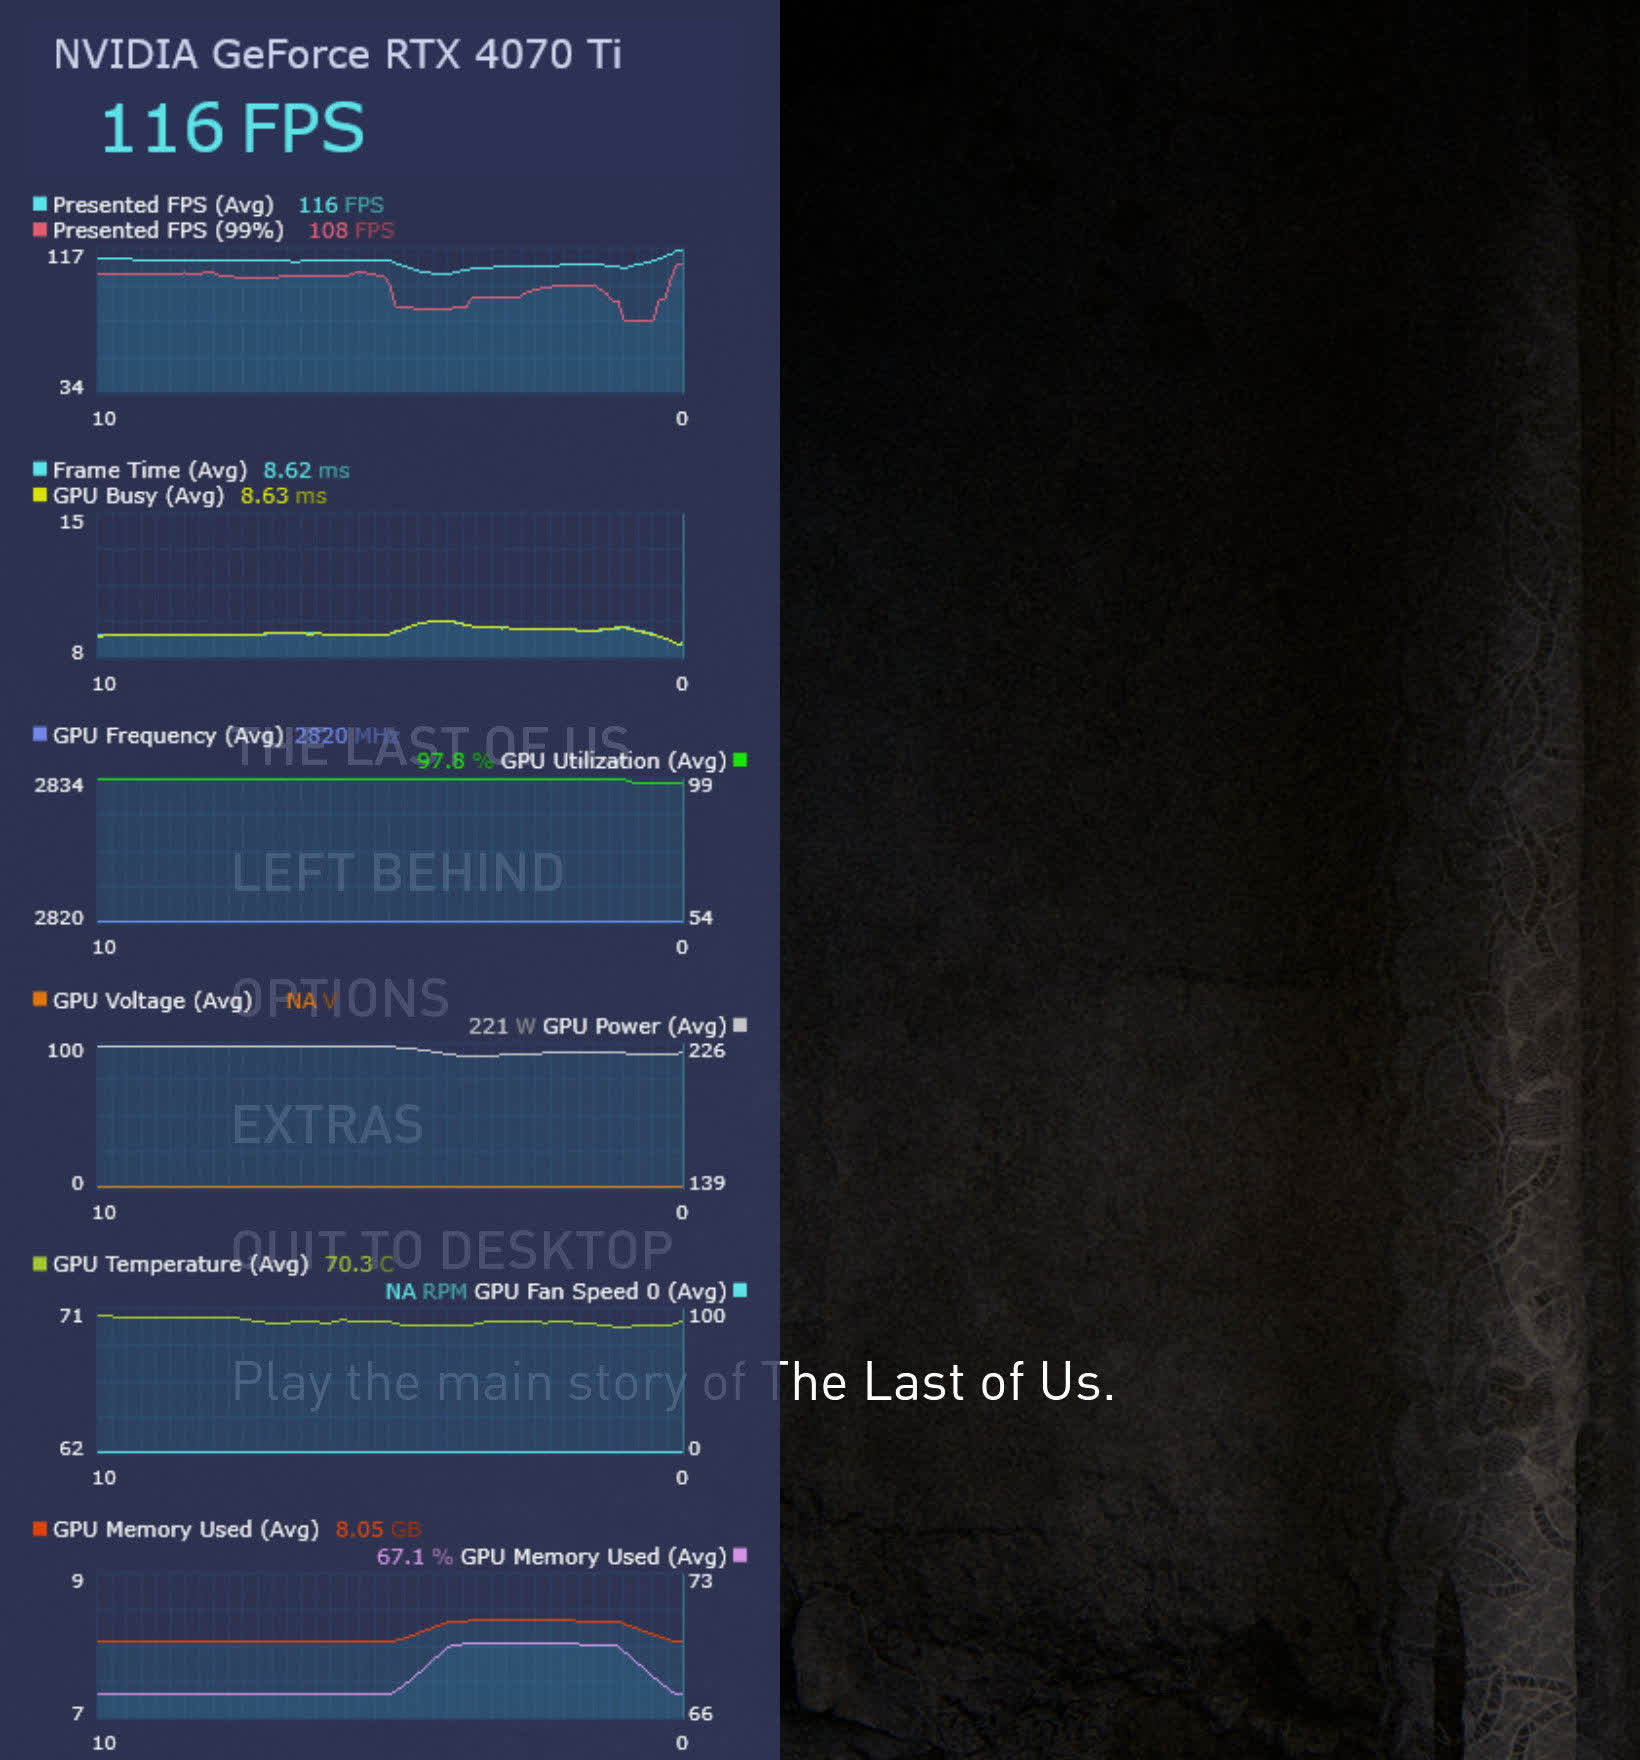
Now look at the difference to when the compiling is over! With the CPU having very little to do, the “performance” of the game’s menu is entirely controlled by the GPU – this is evident from the identical Frame and GPU Busy times, along with the GPU utilization graph. Oh, and before we move on, let us vent our frustration over the fact this game is making this GPU use over 220 W of power, just to display a menu!
… let us vent our frustration over the fact this game (TLOU) is making this GPU use over 220 W of power, just to display a menu!
So does this mean that PresentMon can always show us when a game is being limited (a.k.a. “bottlenecked”) by either the CPU or the GPU? Let’s have a look at some further examples.
Below is a snapshot of Hearts of Iron 4, a real-time strategy game set during World War 2. Such titles are well-known for being heavy on the CPU processor and light on the graphics card, and this is blatantly the case here…
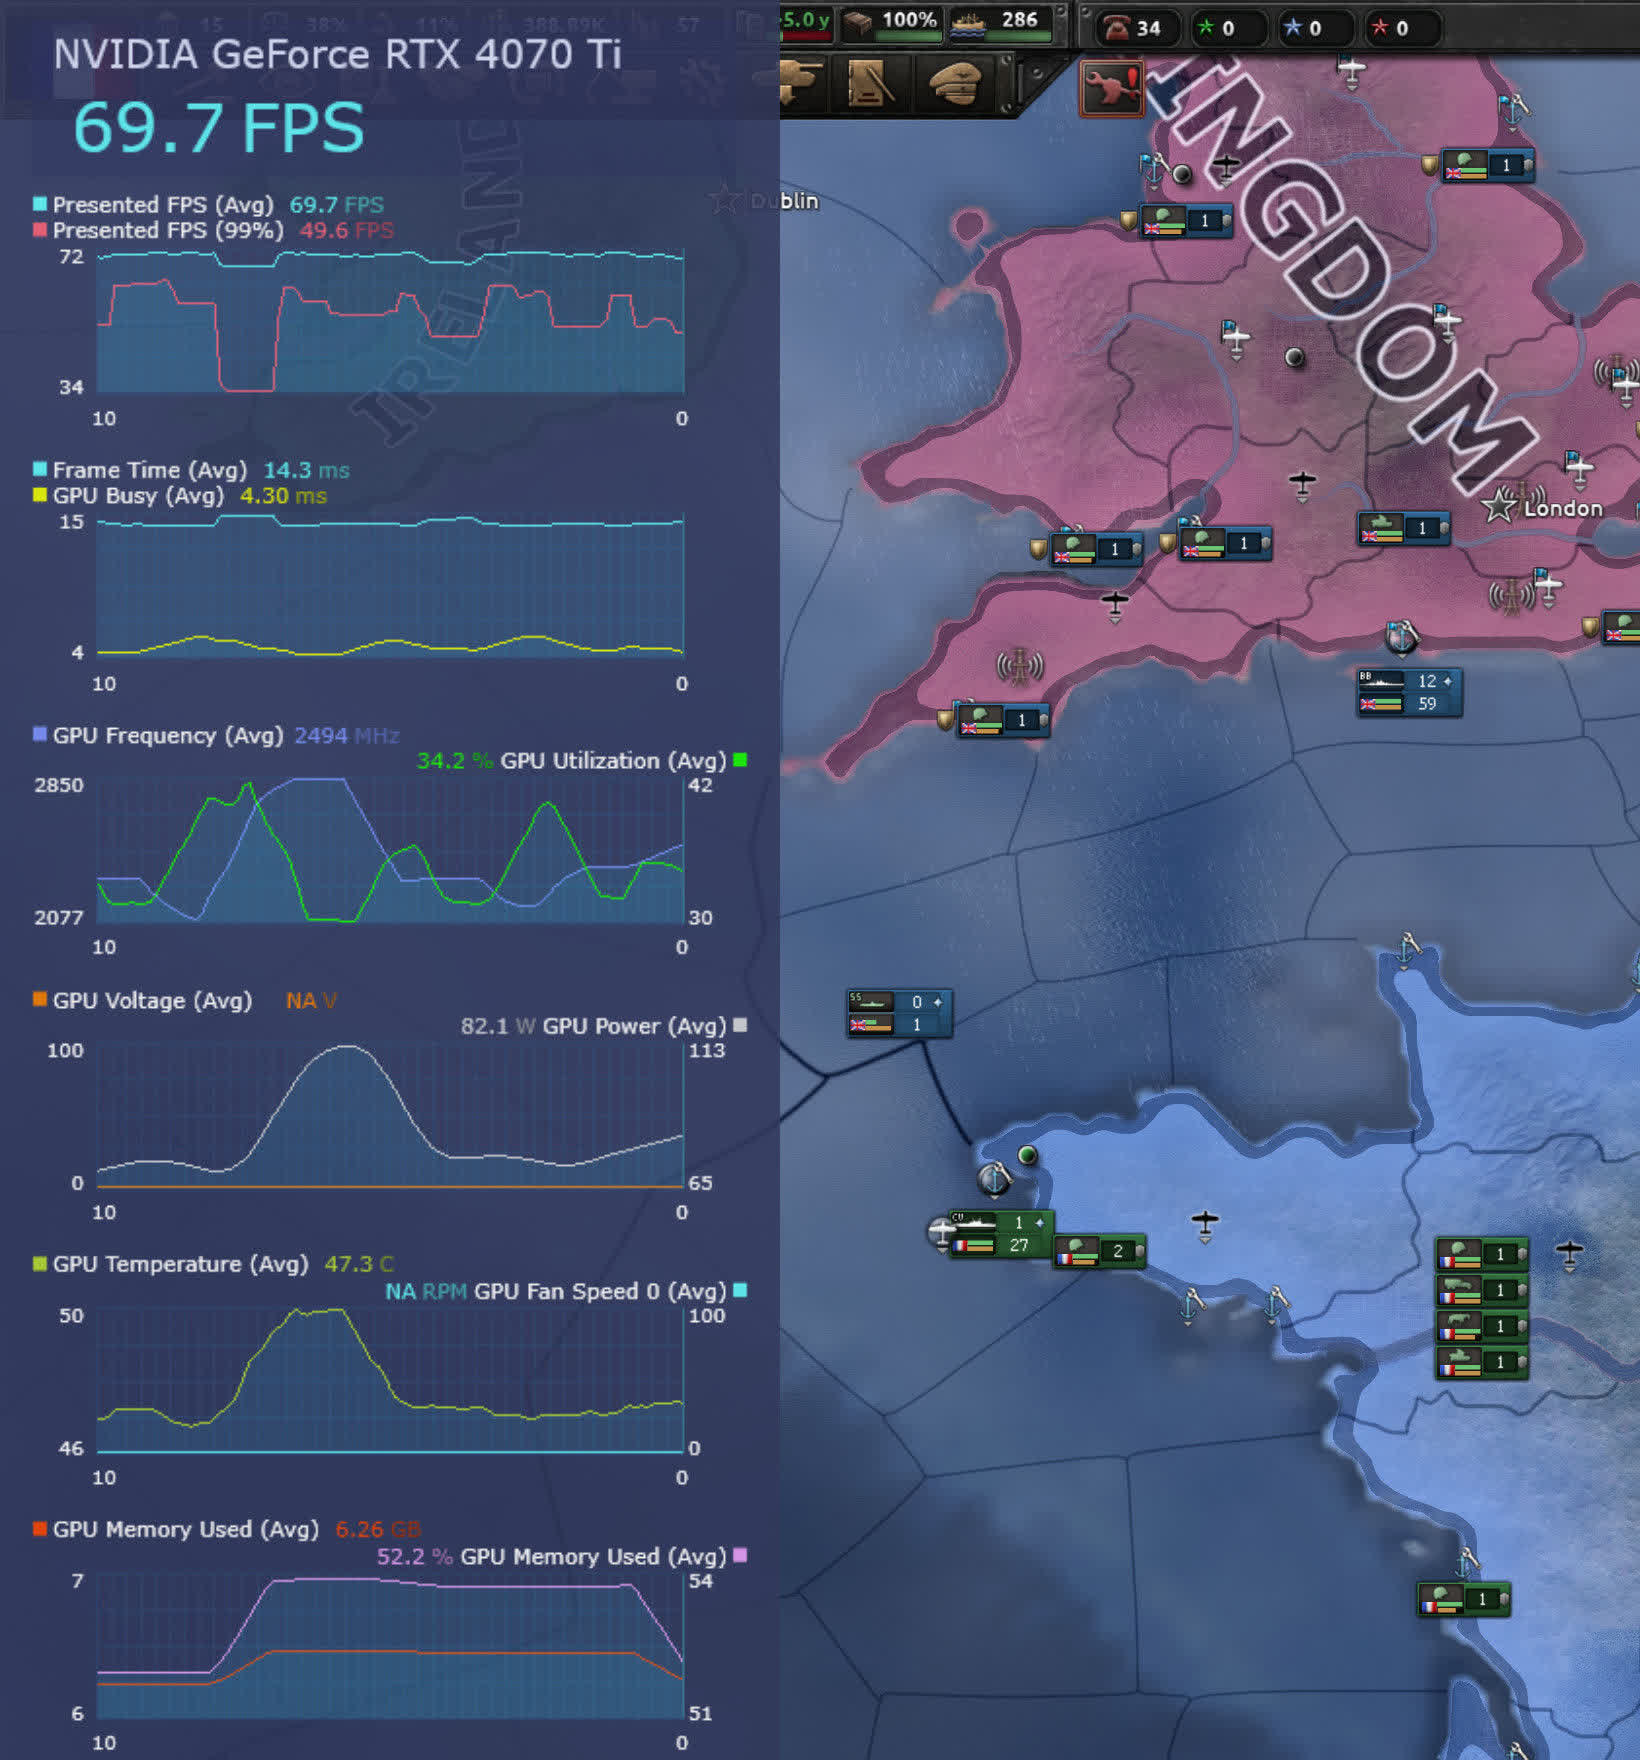
The game’s engine caps the frame rate based on the turn speed setting. However, even at its highest setting, the GPU is busy for only 4.3 ms, with the engine consuming the remaining 11 ms of frame time. In this context, a faster GPU would be advantageous, but a superior CPU would also be beneficial. This isn’t the case in the aforementioned scenario since the frame rate is already at its peak. However, during the later stages of a game run, Hearts of Iron 4 will demand as much CPU power as you can provide.
However, in modern FPS titles, the opposite is true and we can see this by examining Cyberpunk 2077, using two different graphics presets – Medium and RT: Overdrive. The former sets graphics values fairly low and enables FSR 2.1 upscaling (in Auto quality), whereas the latter activates the use of path tracing lighting, along with DLSS upscaling and Frame Generation, if available.
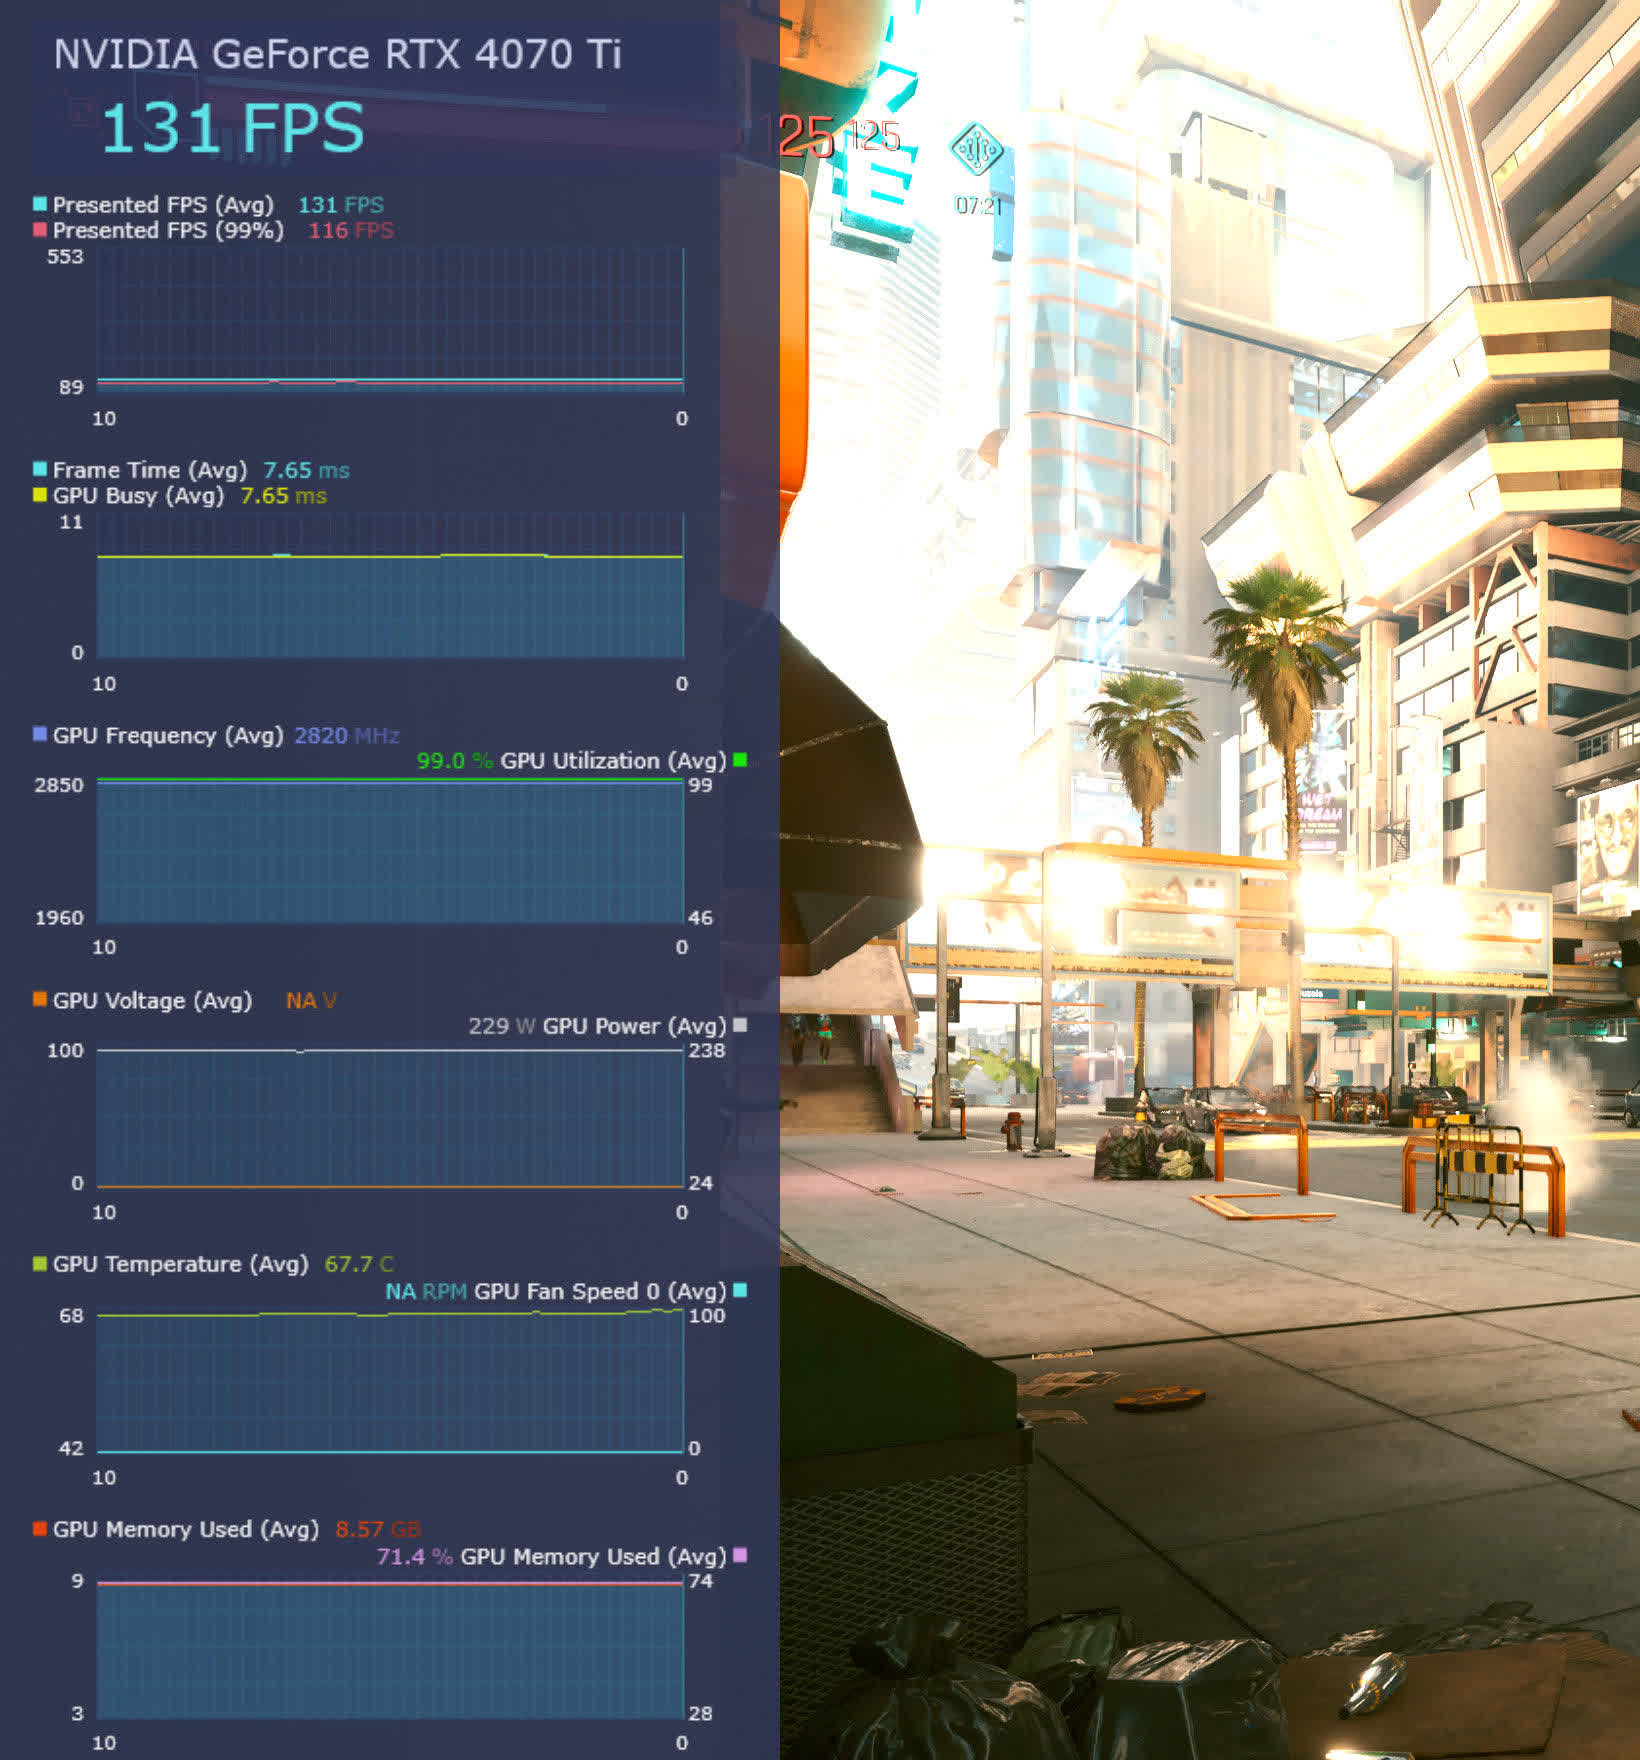
We can clearly see that even with these settings, the performance of CP2077 is entirely limited by the GPU, as the Busy time is practically identical to the Frame time.
The actual frame rate is, of course, perfectly acceptable but if we wanted more speed, then it would be a case of lowering all of the quality settings further or getting a new graphics card. Improving the visuals and firing up path tracing doesn’t change matters very much, as one would expect.
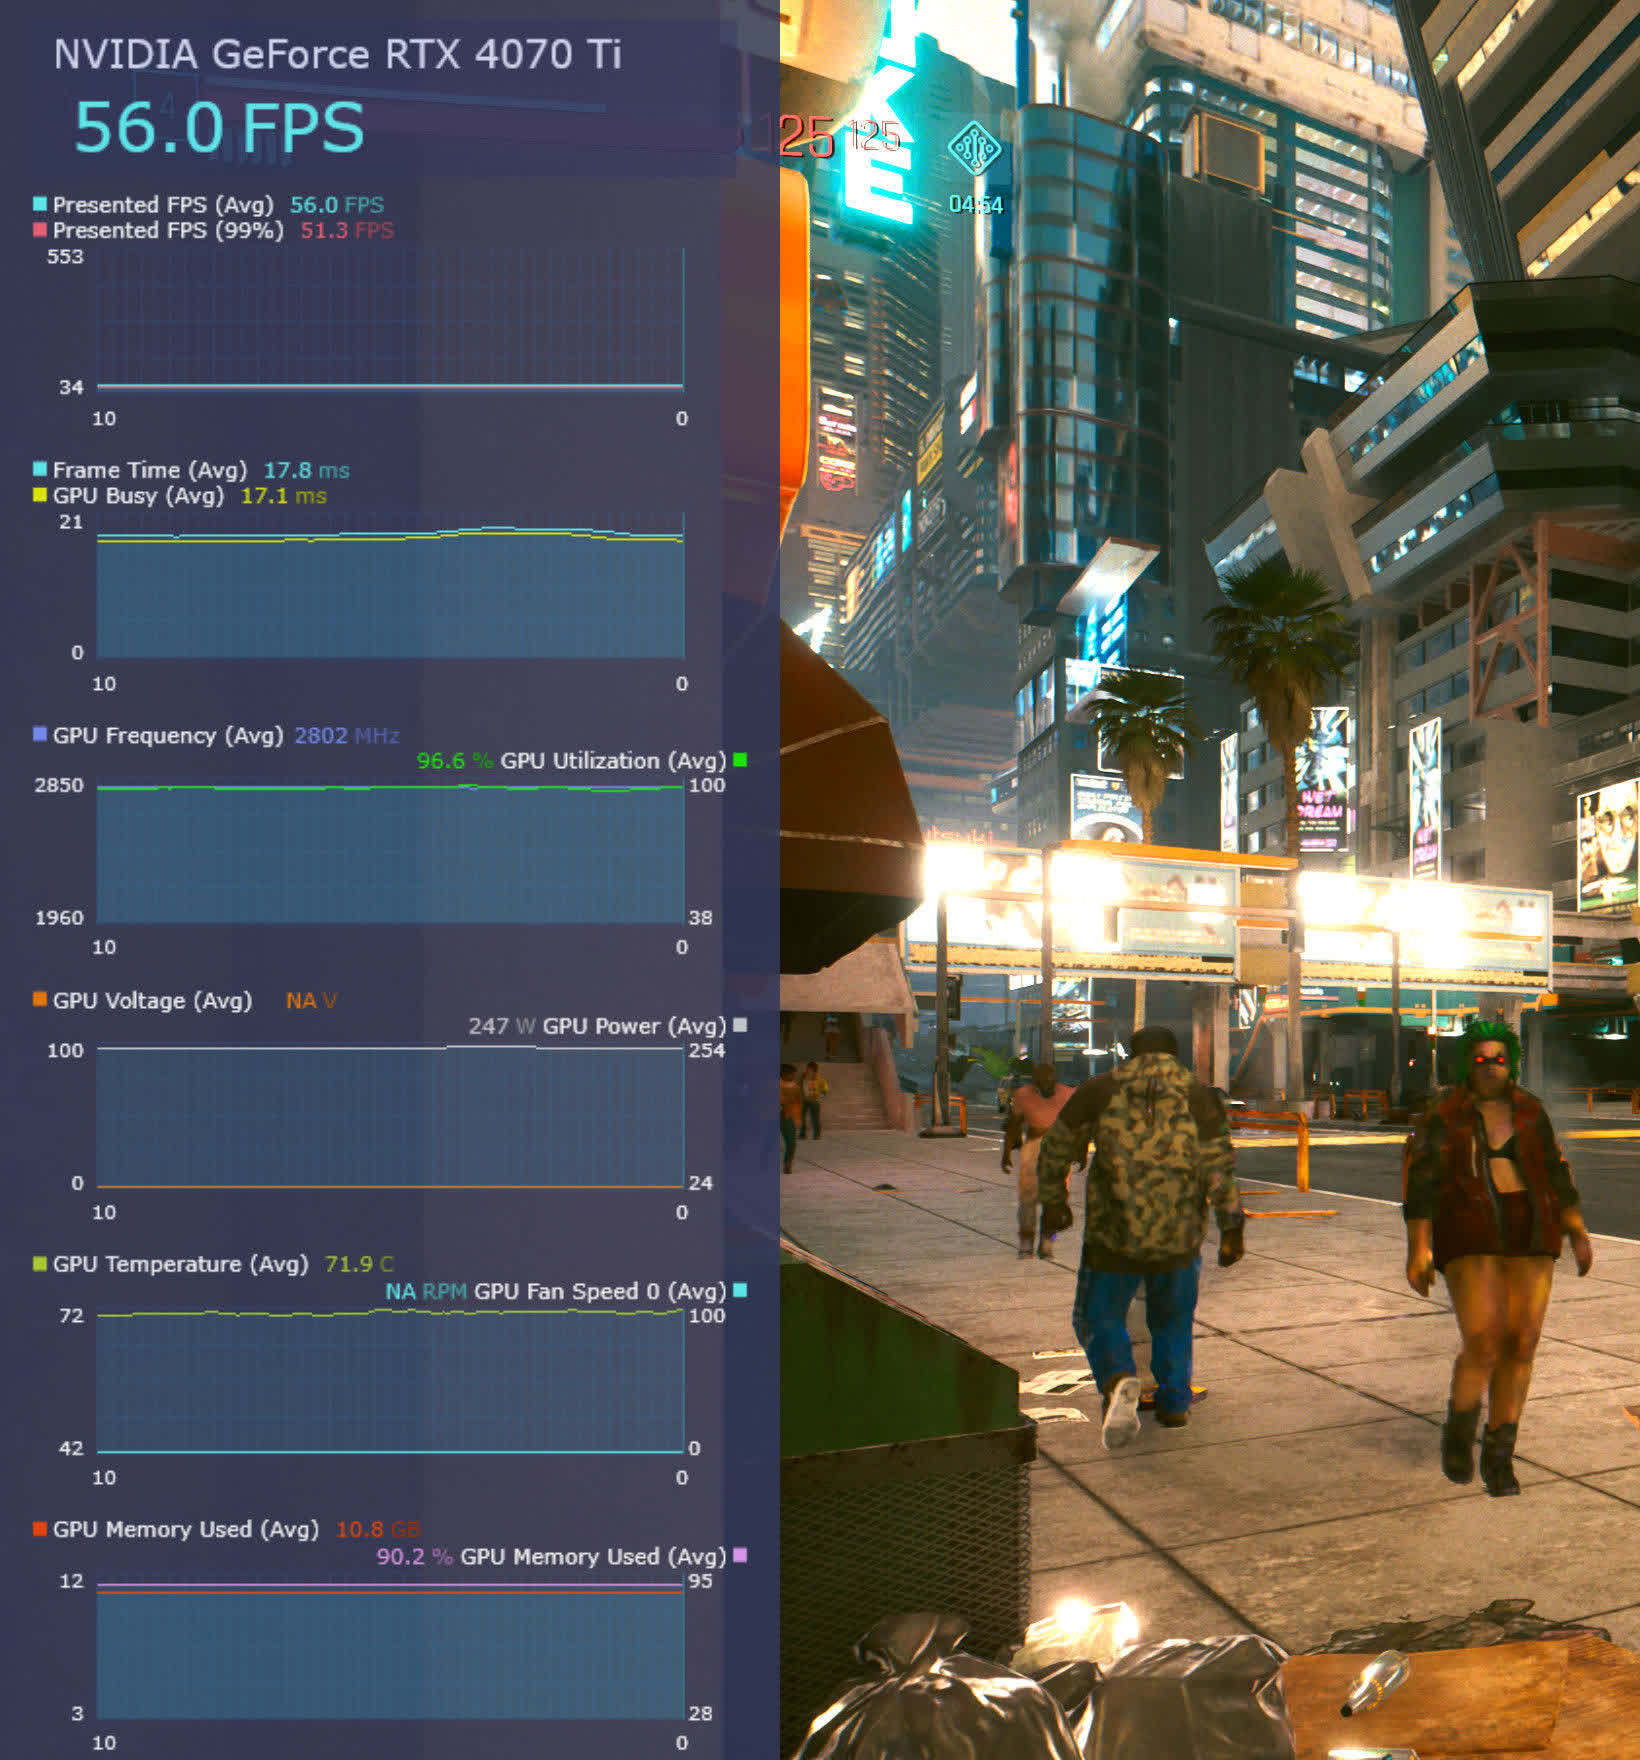
Although it’s not an identical situation in the game (there are now multiple NPCs on the sidewalk, for example), the results were consistently different in that there was now a very small, but permanent, difference between the Frame and GPU Busy times.
While path tracing is extremely demanding on the GPU, the use of ray tracing does increase the amount of work the CPU has to do, albeit not by much in this case.
It also shows that for this particular combination of game, quality settings, and graphics card, a better CPU wouldn’t necessarily make much of a difference. But there are titles where a more modern CPU, with faster RAM, would change the performance.
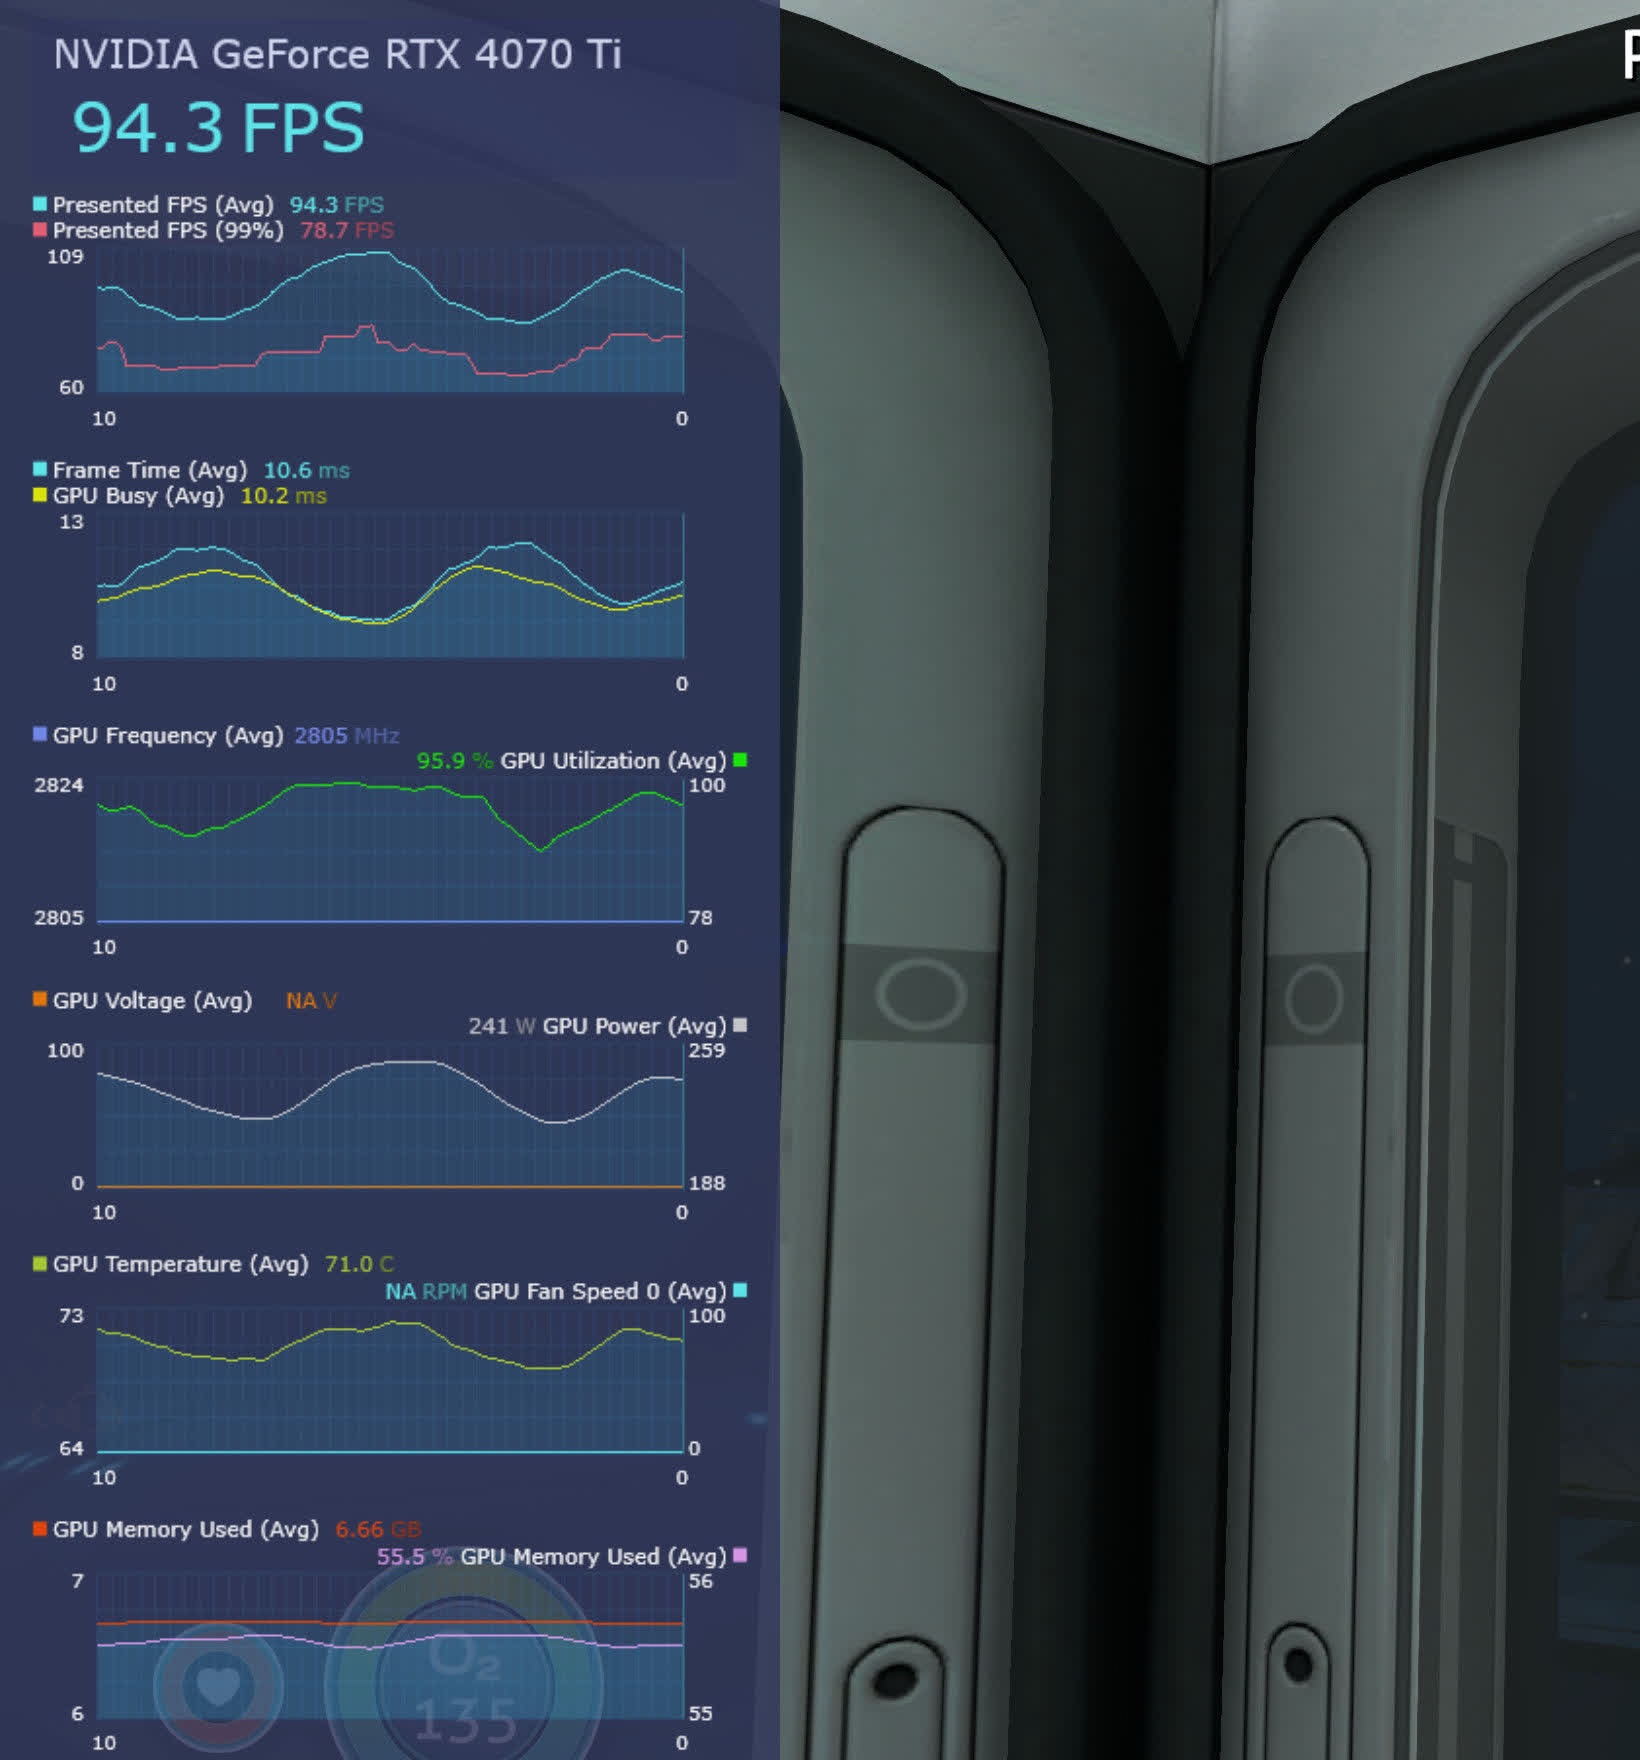
The above snapshot is from the smash hit Subnautica, which uses Unity as the game engine. Here we can see the performance bottleneck constantly shift from being the GPU (when the Frame and Busy times are identical) to the CPU/system/engine when there is a gap of a few milliseconds.
Remember that the longer a frame time is, the lower the frame rate – so the 1% Low value of 78.7 fps is mostly being limited by the system, rather than the GPU.
A word of caution is required, though. Spikes in frame times aren’t always due to a CPU bottleneck and can be caused by factors outside of the capabilities of a single piece of hardware. To demonstrate this, let’s go back to the game we started with, The Last of Us Part 1…
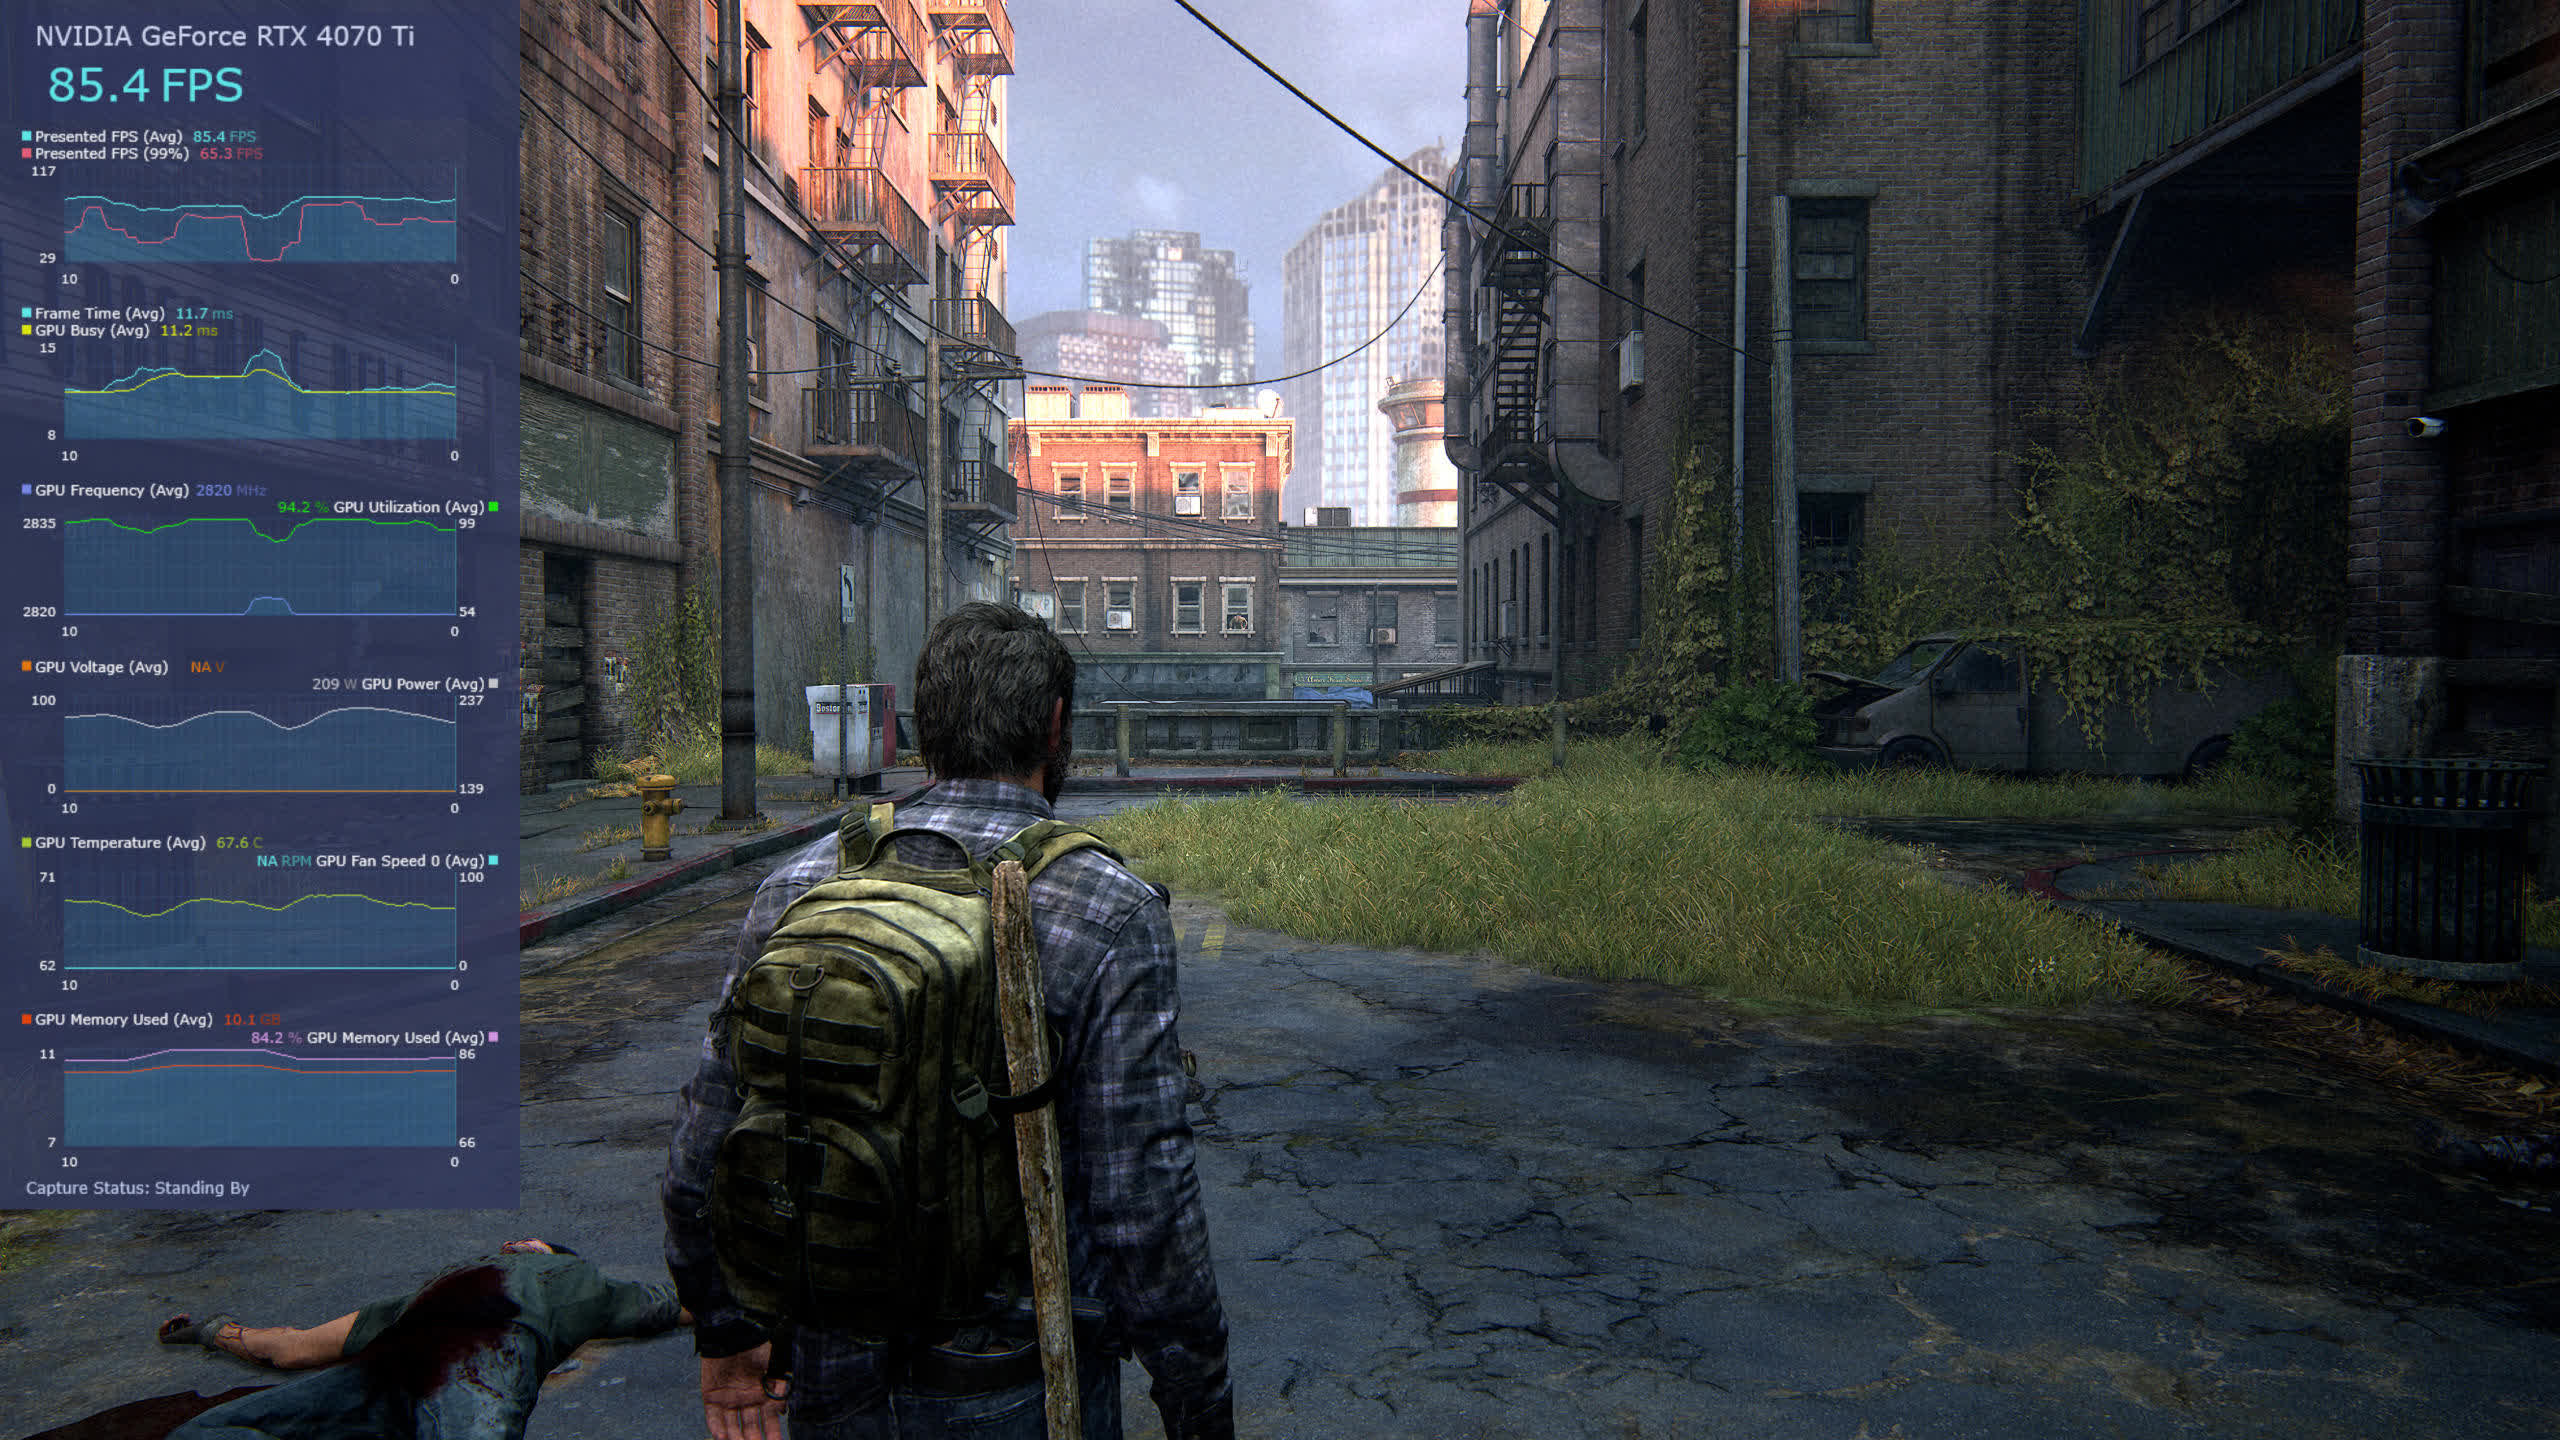
Using Ultra quality settings, the game’s engine tries to stream a lot of assets as fast as possible, and until things have settled down, there’s a fair amount of hitching where the GPU Busy time remains constant, but the overall Frame time spikes in value.
TLOU doesn’t use anything like DirectStorage to improve loading times, so just about every aspect of the system will have an impact on how quickly all of this take place. For the most part, the average performance of the game is predominantly GPU-limited, as shown by the time graphs, but when the asset streaming kicks in, the age of the tested PC becomes somewhat evident.
Is PresentMon worth using?
While we didn’t cover the Capture process in this article, the system worked as intended, collecting values for every metric, regardless of what overlay preset you’re using. That actually gets disabled during capture, as running both at the same time will notably impact performance. The figures are then saved as a csv file, which can rapidly balloon in size, depending on the sampling rates and time spent recording.
Plenty of other apps can do this, too, and the likes of Afterburner and CapFrameX don’t seem to have as many issues with reading metrics correctly as PresentMon does. AMD’s GPU Profiler, Microsoft’s PIX, and Nvidia’s NSight all tend to provide more information for developers and serious analysts. So this makes it somewhat useless, yes?
To a certain degree, this might be the case, as there’s no reason why one should use something that doesn’t work properly. However, PresentMon’s overlay is very customizable and visually appealing, and the summary report for Captures provides quick access to average, min/max, 1% and 5% low frame rates; the Frame and GPU Busy times are especially useful.
At the very least, PresentMon is worth trying out – it’s free to use and there’s nothing to be lost by having the app on your PC. It will interesting to see how Intel continues to improve this new version of its performance monitor tool and if anything special crops up, we’ll be sure to let you know.

